FT SENSOR MANUAL CALIBRATION
Note
Go visit the repository calibration-ft-sensors for the documentation
on the automatic procedure using the KUKA robot 🤖
| Rev. | Dep | Prepared by | Date | Revision description |
|---|---|---|---|---|
| 0.0 | P&M | Tome D. | 15/04/2011 | Preliminary emission |
| 1.0 | iCubFacility | Tome D. – Michelini S. | 05/03/2014 | Added section 2.1 Matlab replaced by Octave New report template |
| 2.0 | iCubFacility | M.Maggiali | 26-01-2018 | Added picture of the STRAIN2 and wiring of STRAIN2 and other details. |
| 2.1 | iCubFacility | D.Tomé | 17/04/19 | E.Barbieri modified wiring diagram (p.11) to fit with both old and new mechanics |
| 2.2 | iCubFacility | D.Tomé | 15/07/2019 | Added image that shows associations between pcb’s pads and analog channel numbers (add. 1) |
| 2.3 | iCub Tech | M.Borgagni - D.Tomè | 11/02/2020 | F/T Calibration Procedure updated (FirmwareUpdater) - migrated to markdown |
1 SW/HW Requirements
1.1 Software Requirements
- Create a icub-tech folder under C: (just to keep some files)
- ESD CAN SDK (contains CanReal) :
\\storage05.icub.iit.local\repository\common\drivers_and_software\esd_can\can_sdk_v620.zip - GULP (copy both files, install gulp and then wincap):
\\storage05.icub.iit.local\repository\mechatronics\electronics\Organization\GULP -
ORACLE VirtualBox(download also VirtualBox Extension Pack, install virtual box then ext pack): https://www.virtualbox.org/wiki/Downloads
-
GIT for Windows : https://git-scm.com/download/win
-
Tortoise GIT: https://tortoisegit.org/download/
-
ST-LINK Utility (for flashing updated bootloader and firmware) :
\\storage05.icub.iit.local\repository\production\TEST STUFF\SoftwareToInstall\ST-LINK Utility -
ESD CAN-USB Drivers (copy in icub-tech, to be used for driver installation of ESD CAN-USB 2066):
\\storage05.icub.iit.local\repository\production\TEST STUFF\SoftwareToInstall\CAN_CD_V11 -
Ubuntu 18.04 LTS VM (ready to go with yarp, icub, ftSens repo etc.; copy in icub-tech):
\\storage05.icub.iit.local\repository\production\TEST STUFF\VM\ubuntu 18.04.7z -
icub-firmware-build repository (checkout devel branch): https://github.com/robotology/icub-firmware-build.git
-
FT Sensor Repository https://github.com/icub-tech-iit/calibration-ft-sensors
1.2 Hardware Requirements
- 1 strain gauge sensor “GS” (Figure 1)
- 1 bottom cover for strain gauge sensor “BC”(Figure 1)
- 1 top cover for Strain Gauge Sensor “TC”(Figure 1)
- 1 PCB STRAIN2, (IITCODE 11996.x) “STR” (Figure 1)
- 3 sets of 6 tinned cables with these spec : length = 33mm , colors : Blue, Red, Yellow, Green, Black, White “CAB1” (Figure 1)
- 1 cable for connecting the sensor to power and CAN-USB (IITCODE 12478.x) “CAB2”(Figure 1)
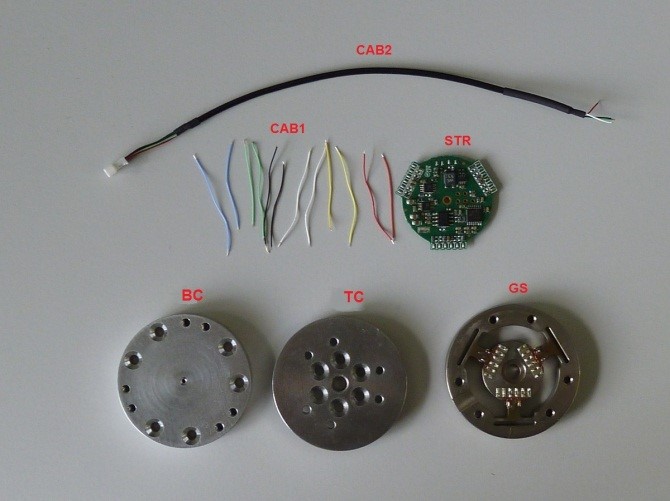
Figure 1: Strain gauge sensor, strain pcb, cables and covers
__________________________________________________________________________________________________________________
Serve nuova foto con strain2, meccanica nuova e i fili 3 per colore anziché 2
- 1 STRAIN2_ProgramInterface IITCODE 12348.x (Figure 2)
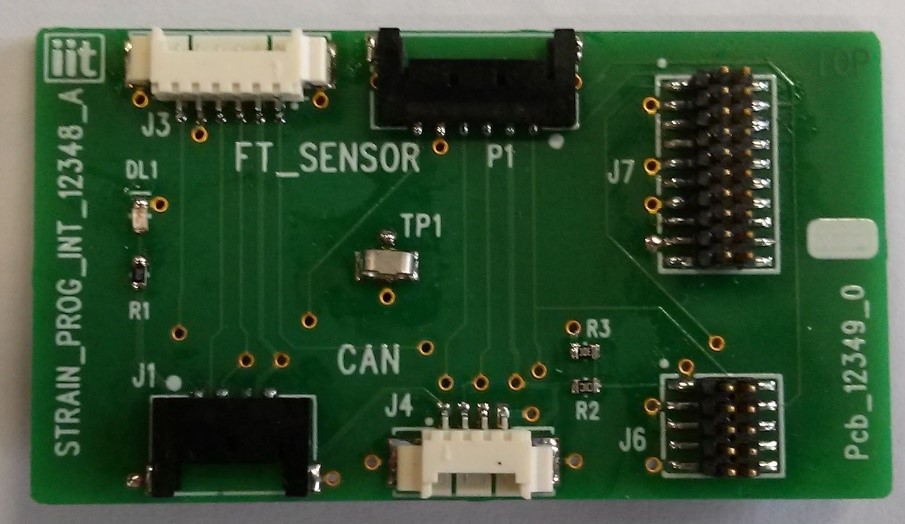
Figure 2 STRAIN2_ProgramInterface
________________________________________________________________________________________________
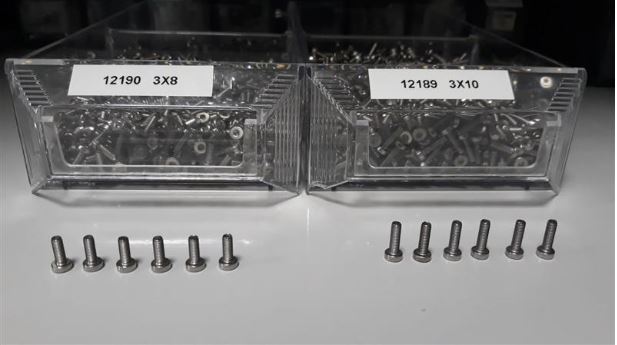
Figure 3: Screws
________________________________________________________________________________________________
- 1 custom made cross “CR1” (Figure 4)
- 1 custom made head “H1” (Figure 4)
- 1 custom made head “H2” (Figure 4)
- 1 nut FeZn 10MA.2 “N1” (Figure 4)
- 6 3x16x2mm inox countersunk hexagonal screws “SC1” (Figure 4)
- 6 3x18x2.5mm inox hexagonal screws “SC2” (Figure 4)
Figure 4: Custom made cross, heads and the nut
________________________________________________________________________________________________
Figure 5: Custom made H bracket ________________________________________________________________________________________________
- 1 tightening knob “K1” (Figure 6)
- 1 Set of spacers “S1” (Figure 6)
- 1 Z axis extension “EXT1” (Figure 6)
6
Figure 6: Custom made spacer, Z axis extension and knob
________________________________________________________________________________________________
- 1 Z axis extension “EXT2” (Figure 7)
Figure 7: Custom made Z axis extension
________________________________________________________________________________________________
- 1 2mm torque screwdriver “TS1” (Figure 8)
- 1 2mm hexagonal screwdriver “HS1” (Figure 8)
- 1 2.5mm hexagonal screwdriver “HS2” (Figure 8)
- 1 wrench 17mm “W1” (Figure 8)
Figure 8: Screwdrivers
________________________________________________________________________________________________
- Clamps to fix the structure “CL1” (Figure 9)
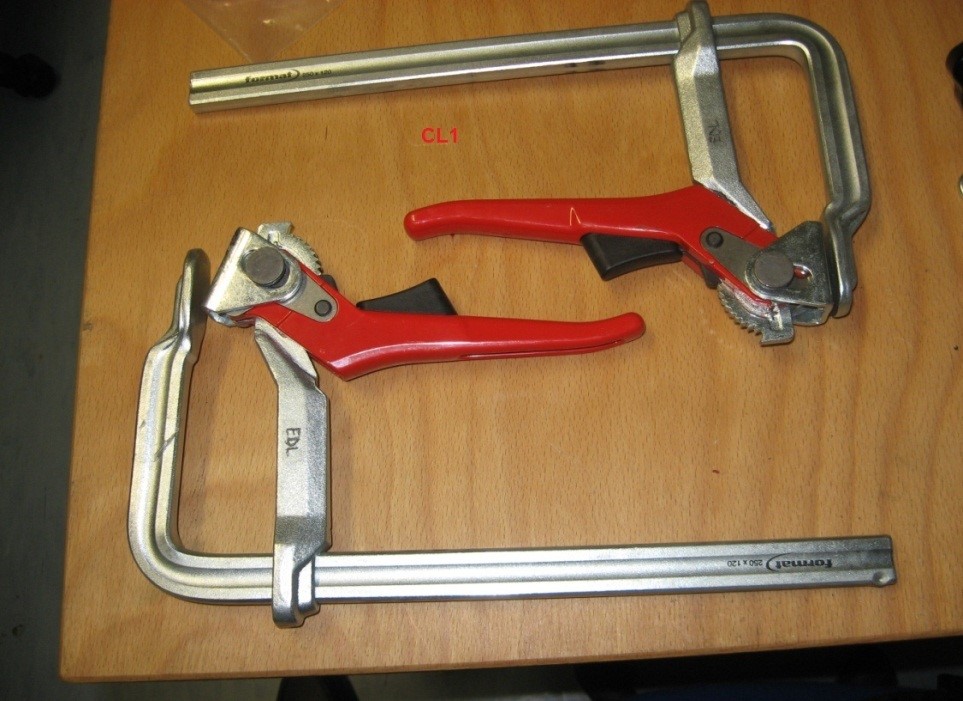
Figure 9: Clamps
________________________________________________________________________________________________
- 1 CAN-USB with power and can bus connection cables 3333.B (Figure 10)
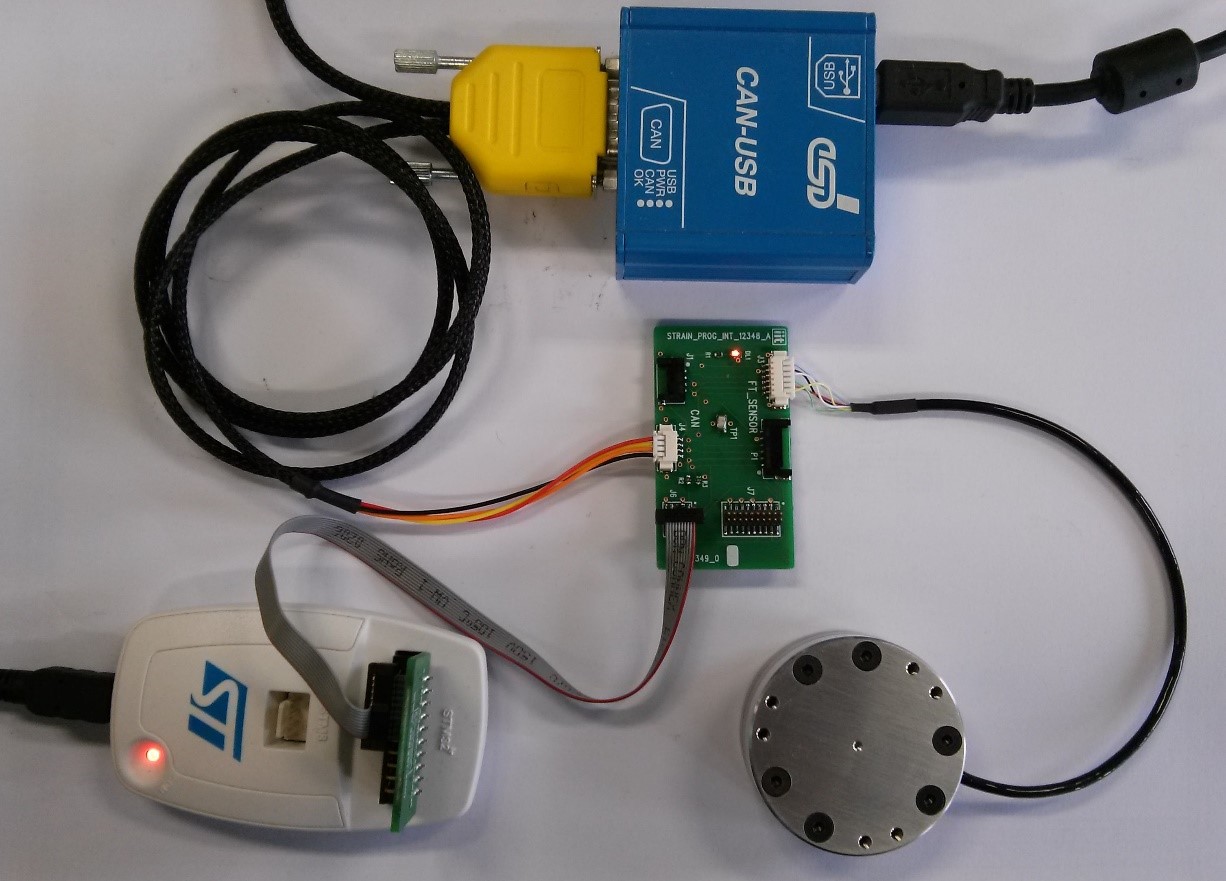
Figure 10: CAN-USB with its cables and connection with the FT-SENSOR
________________________________________________________________________________________________
-
1 25Kg load
-
1 5Kg load
2 Sensor Assembly
Warning
Handle the sensor taking care not to break thin wires
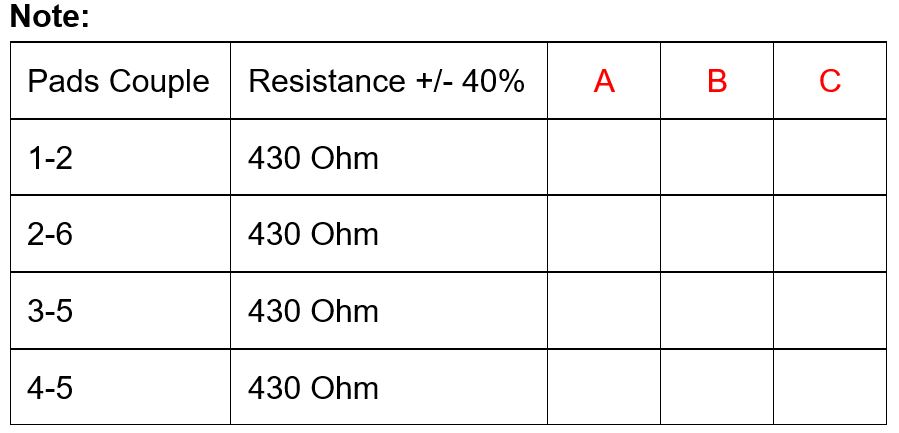
2.1 Strain Gauge Resistance check
TEST: Take the sensor and measure the resistance of each couple of pads for each of three groups as shown below and fill in the respective test report field.
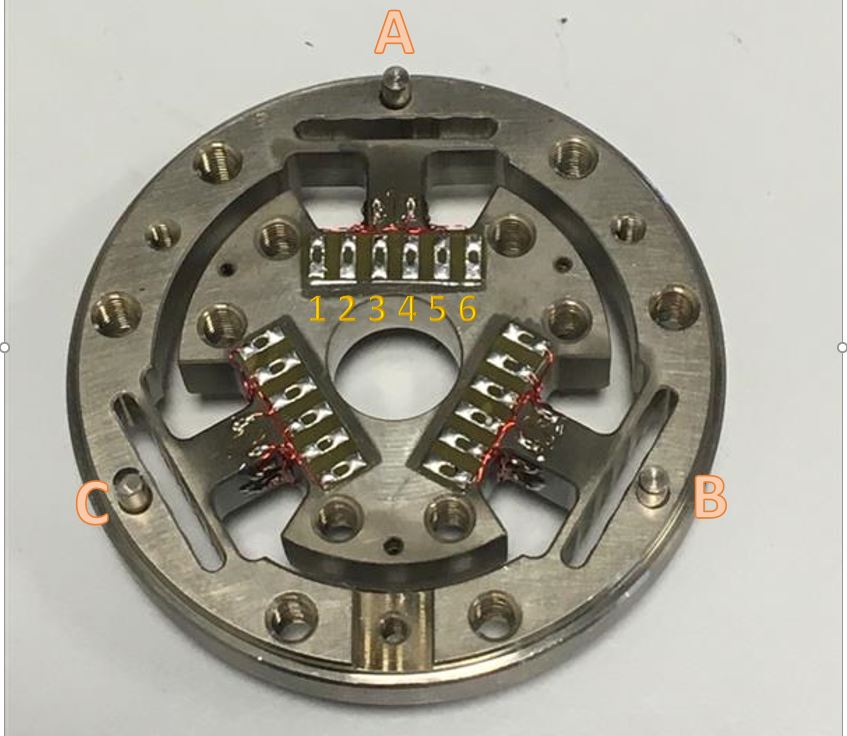
Figure 11: Strain gauge sensor resistance check
| Pads Couple | Resistance ± 40% |
|---|---|
| 1-2 | 430 Ohm |
| 2-6 | 430 Ohm |
| 3-5 | 430 Ohm |
| 4-5 | 430 Ohm |
Fill in the table in the test reports with values of the resistive strain gauge.
Warning
Attention! comply with the pairs as shown.
- Solder the wires CAB1 ( Figure 1 ) to the sensor as shown below
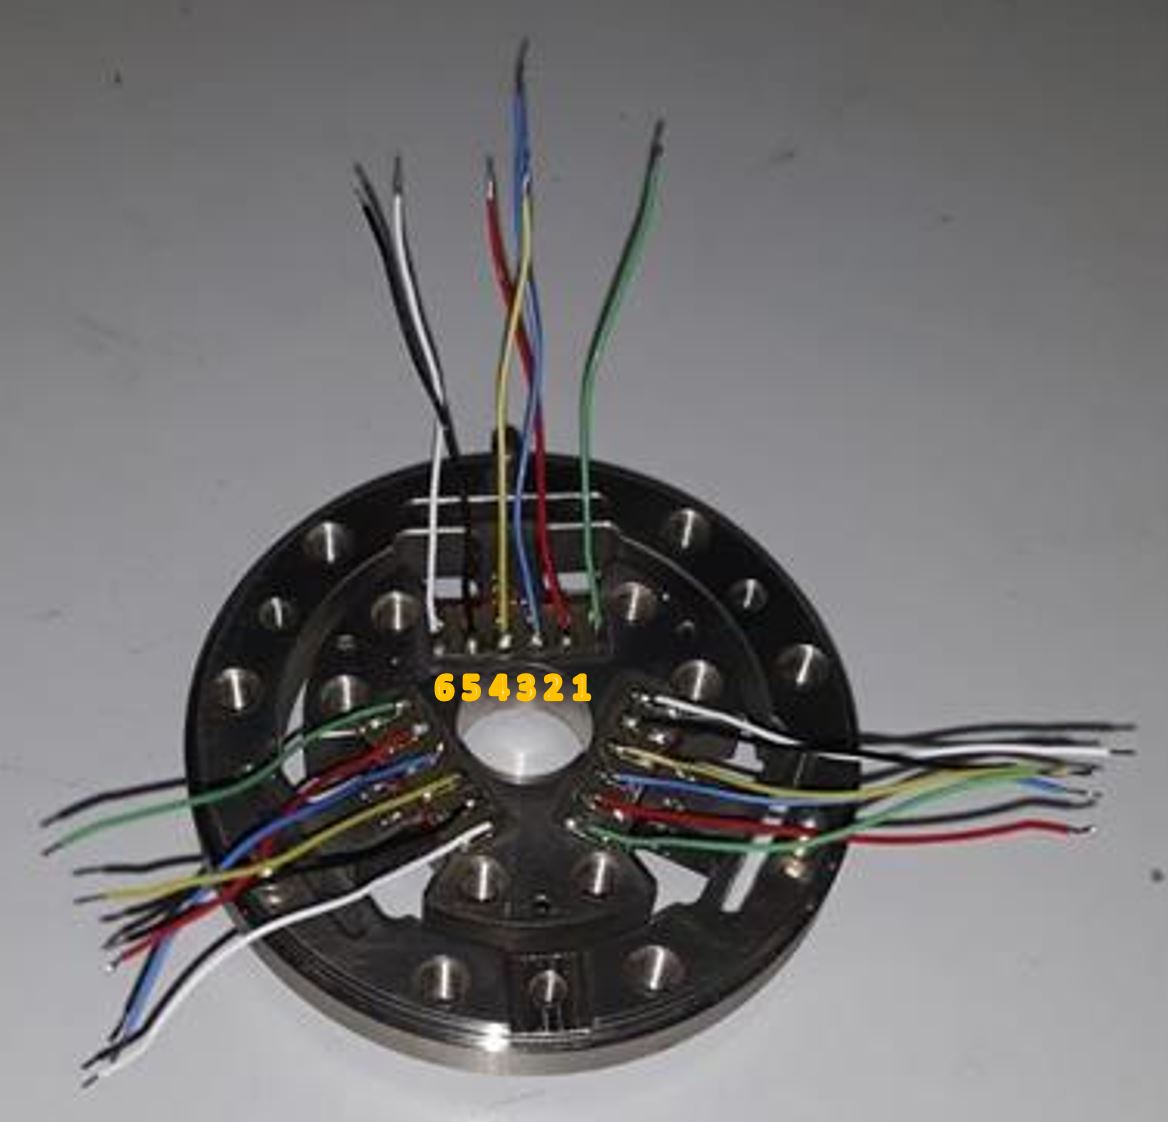
Figure 12: Sensor wired
| Pin | Colour |
|---|---|
| 1 | GREEN |
| 2 | RED |
| 3 | BLUE |
| 4 | YELLOW |
| 5 | BLACK |
| 6 | WHITE |
________________________________________________________________________________________________
- Pass the wires CAB1 (Figure 1) according images below
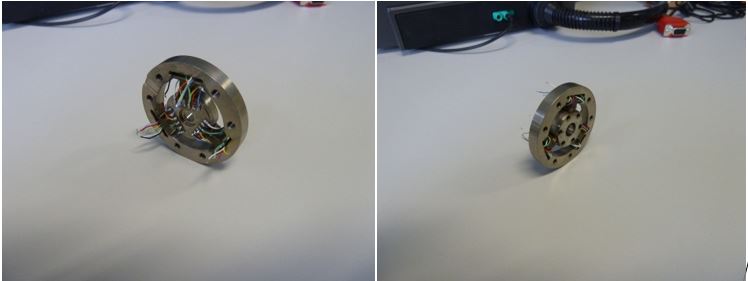
Figure 13: Wire configuration
________________________________________________________________________________________________
- Solder the wires CAB1 (Figure 1) to the Strain PCB as shown below
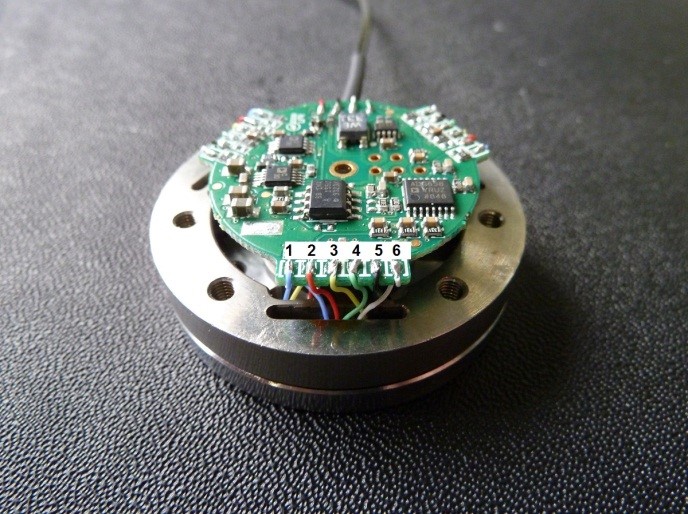
Figure 14: Sensor wired to the Strain PCB (the sequence of the wires is equal from STRAIN and STRAIN2)
| Pin | Colour |
|---|---|
| 1 | BLUE |
| 2 | RED |
| 3 | YELLOW |
| 4 | GREEN |
| 5 | BLACK |
| 6 | WHITE |
________________________________________________________________________________________________
- Solder the wires CAB2 (Figure 1) to the Strain PCB as shown below
Figure 15A Wiring of the STRAIN2
________________________________________________________________________________________________
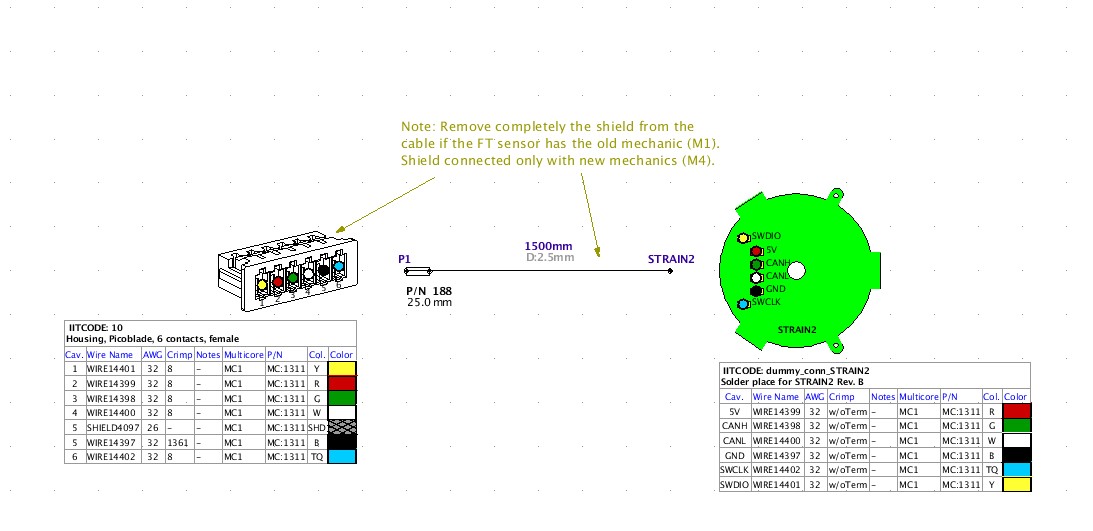
Fig 15B Capital scheme of the strain-2 connections ________________________________________________________________________________________________
- Assembly the sensor with its covers TC and BC (Figure 1) using appropriate screws tightening them using the torque screwdriver TS1 (Figure 8) settled at 2N/m as described in the following drawing link and extracted notes
Link to new mechanical drawing
Notes
Steps to be taken before assembling and calibrating the FT sensor. Contact technical office for any information about this procedure.
-
You need to pre-assemble the FT sensor with the top and bottom covers, central sensor and screws (as shown in Fig.Step1).
-
Align the holes for dowel pins before tightening the screws of the bottom and top covers.
-
Drill holes of n1.9mm for the dowel pins on &model_name:16 and &model_name:14 and increase them to &d59:1. Test the holes using a Dowel pin of size: ISO 2338B n3.
-
Drill holes of n1.9mm for the dowel pins on &model_name:0 and increase them to &d129:1. The pins will be interference fit on this component.
-
VERY IMPORTANT: You have to engrave a" part number" -" serial number" on the three parts which were just assembled with the same denominations used in the production department of IIT before you can disassemble it.
-
The part number for this assembly is 12487 , about the S/N ask to IIT Production department. Typically, the format is the following: "00000 - S/N000" where the zeroes stand for a 5-digit and a 3-digit numerical code.
-
Send the part IC_008_P_001 for gluing on the strain gauge. (Refer to Fig.STEP 2)
-
Assemble the FT sensor (as shown in Fig.STEP 3) and calibrate it according to IIT specifications
2.2 Short circuit Check
· Test the wires black red green and white (molex connector) between them and read the resistive values.
| Color wire connections | Result |
|---|---|
| RED - GREEN | Open Circuit |
| RED - WHITE | Open Circuit |
| RED - BLACK | Open Circuit |
| GREEN - WHITE | ± 70KΩ |
| GREEN - BLACK | Open Circuit |
| WHITE - BLACK | Open Circuit |
| YELLOW - BLACK | Open Circuit |
| TURQUOISE - BLACK | Open Circuit |
| BLACK - chassy of the sensor | Open Circuit |
| WHITE - chassy of the sensor | Open Circuit |
| RED - chassy of the sensor | Open Circuit |
| GREEN - chassy of the sensor | Open Circuit |
| YELLOW - chassy of the sensor | Open Circuit |
| TURQUOISE - chassy of the sensor | Open Circuit |
Warning
If you do not respect the values shown in the table STOP CALIBRATION AND GIVE BACK TO IIT THE SENSOR FOR INVESTIGATION
3 Pre-calibration Check
-
Connect the F/T sensor , CAN-USB, and ST-LINK2 to the STRAIN_PROGRAM_INT as per Fig10 (and them to the PC):
-
Browse to “C:\icub-tech\icub-firmware-build\CAN\strain2\st-link” and run “st-link_STRAIN2.bat” (this will flash the bootloader/application)
- Open the Virtual Machine (user icub, pw icub) and check that the ESD USB-CAN is attached to it (see picture below)
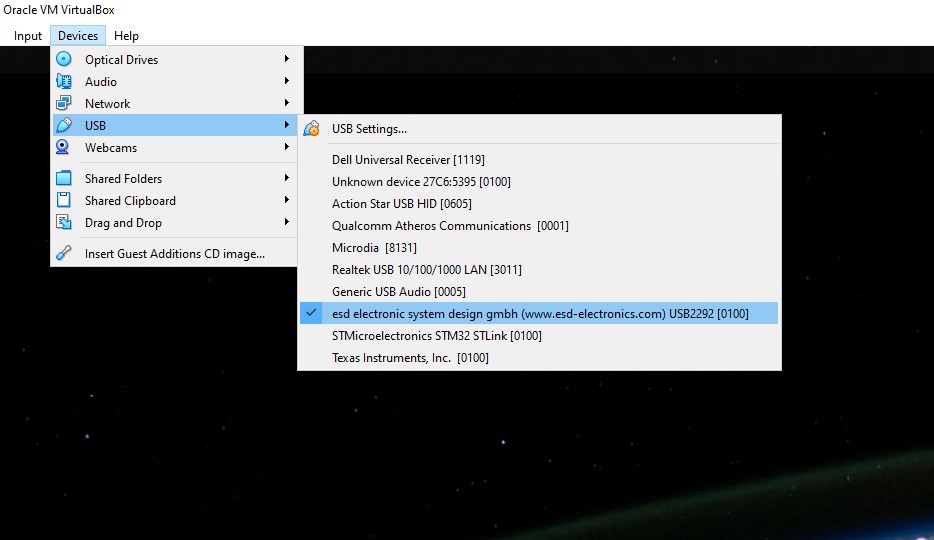 Figure 17
________________________________________________________________________________________________
Figure 17
________________________________________________________________________________________________
- Open a terminal in the VM (CTRL+ALT+T) and run “setEsdCan.sh” (enables the ESD USB-CAN linux driver) ________________________________________________________________________________________________
- Open a terminal in the VM (CTRL+ALT+T) and run “FirmwareUpdater -a” (opens the FirmwareUpdtaer GUI) then select “SOCKETCAN<0>” as device and click on Discover button
 Figure 18
________________________________________________________________________________________________
Figure 18
________________________________________________________________________________________________
Do the following test
- Select the strain2 (1) and click on Calibrate (2)
- in the new window fill SN filed(3) and click on Change (4)
- click on Clear and Apply (5, 6); check that the ADC values (7) are close to 0.
- Click on Close (8) and confirm saving data to Eeprom.
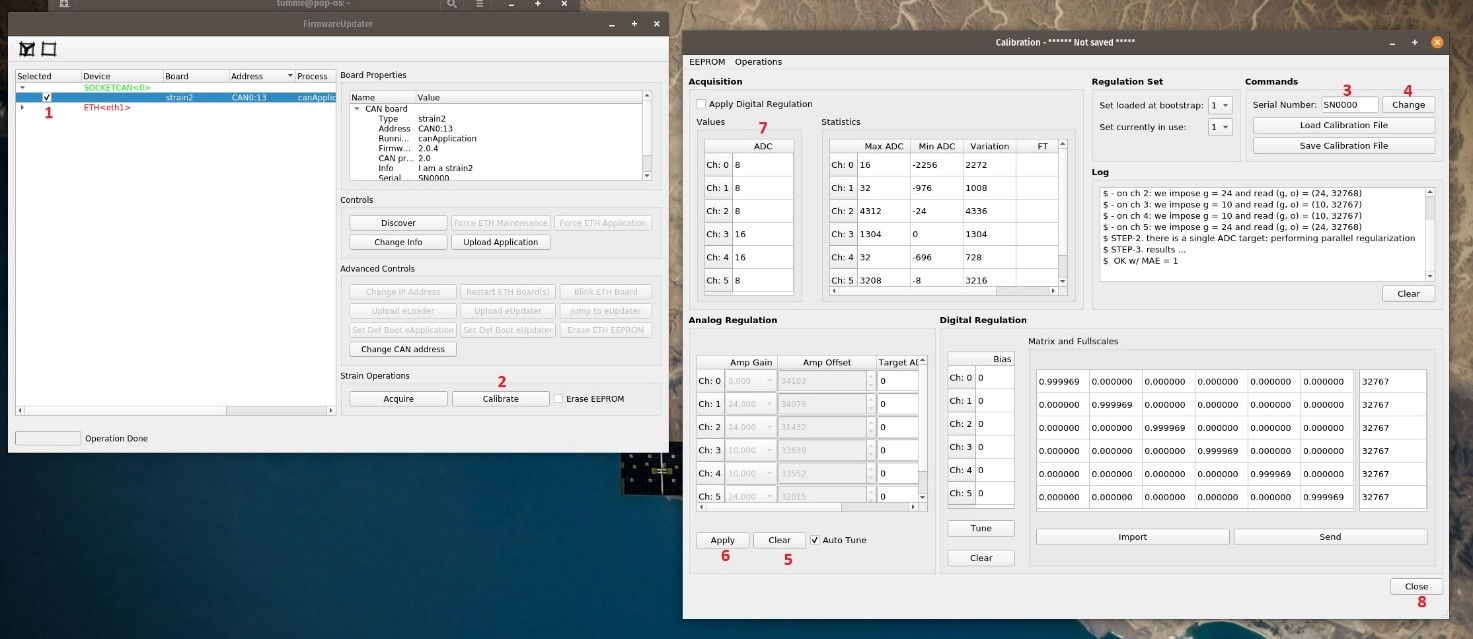 Figure 19
________________________________________________________________________________________________
Figure 19
________________________________________________________________________________________________
- Power Off the VM (or disconnect the ESD USB-CAN)
________________________________________________________________________________________________
- Open CanReal, Select Send->Load List” and browse to “C:\icub-tech\ftSensCalib\software\sensAquisitionArchive\calib_config_files” then load the “canreal_commands.cspsl” configuration file
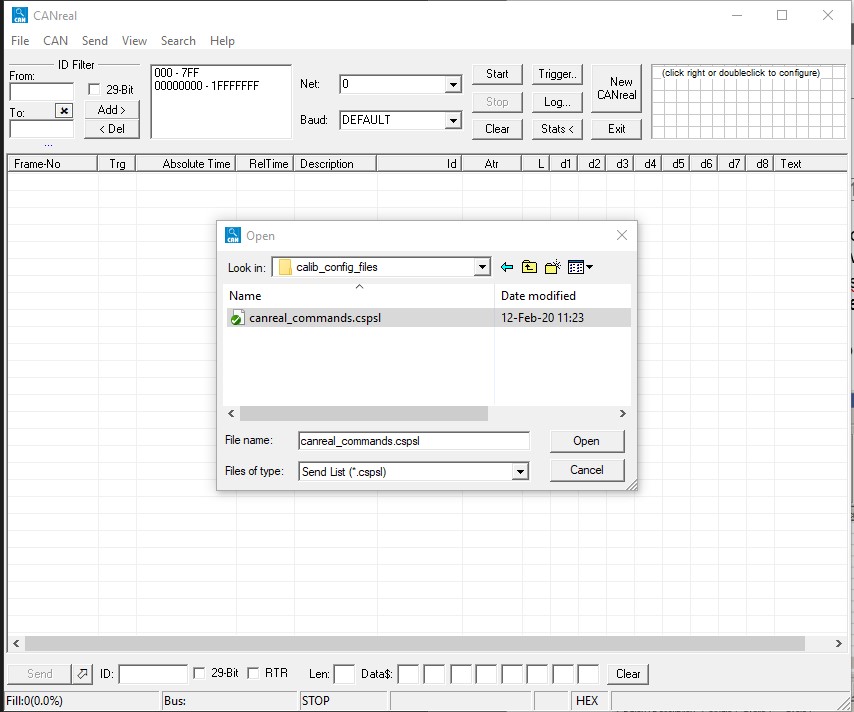 Figure 20
________________________________________________________________________________________________
Figure 20
________________________________________________________________________________________________
- Set Baud to 1000 (1), click on Start (2), then send the command (3); you will see the streaming of the sensor readings (4)
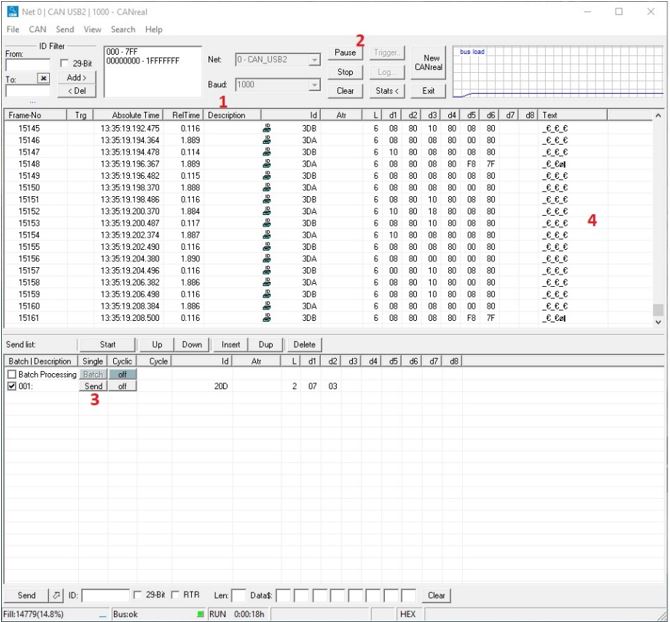
Figure 21
________________________________________________________________________________________________
- Launch Gulp, then select File->Load Parameters, then browse the con file in C:\icub-tech\ftSensCalib\software\sensAquisitionArchive\calib_config_files
________________________________________________________________________________________________
- Select Graph tab, click on “Start” button on the bottom right and you should see 6 colored lines
________________________________________________________________________________________________
- Refer to the picture (Figure 22) place the sensor on the table , press near the three couple of screw holes (A,B,C ) and you should see lines moving DOWN in the gulp window (Figure 23)
Warning
if you do not see lines moving down DO NOT CONTINUE THE CALIBRATION PROCEDURE.
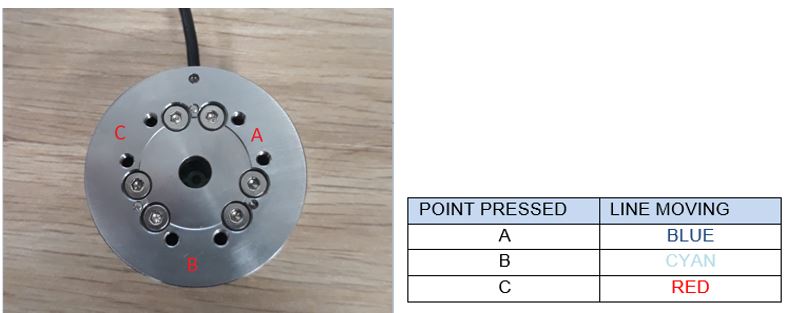
Figure 22:Gulp Pressing Point-Lines association
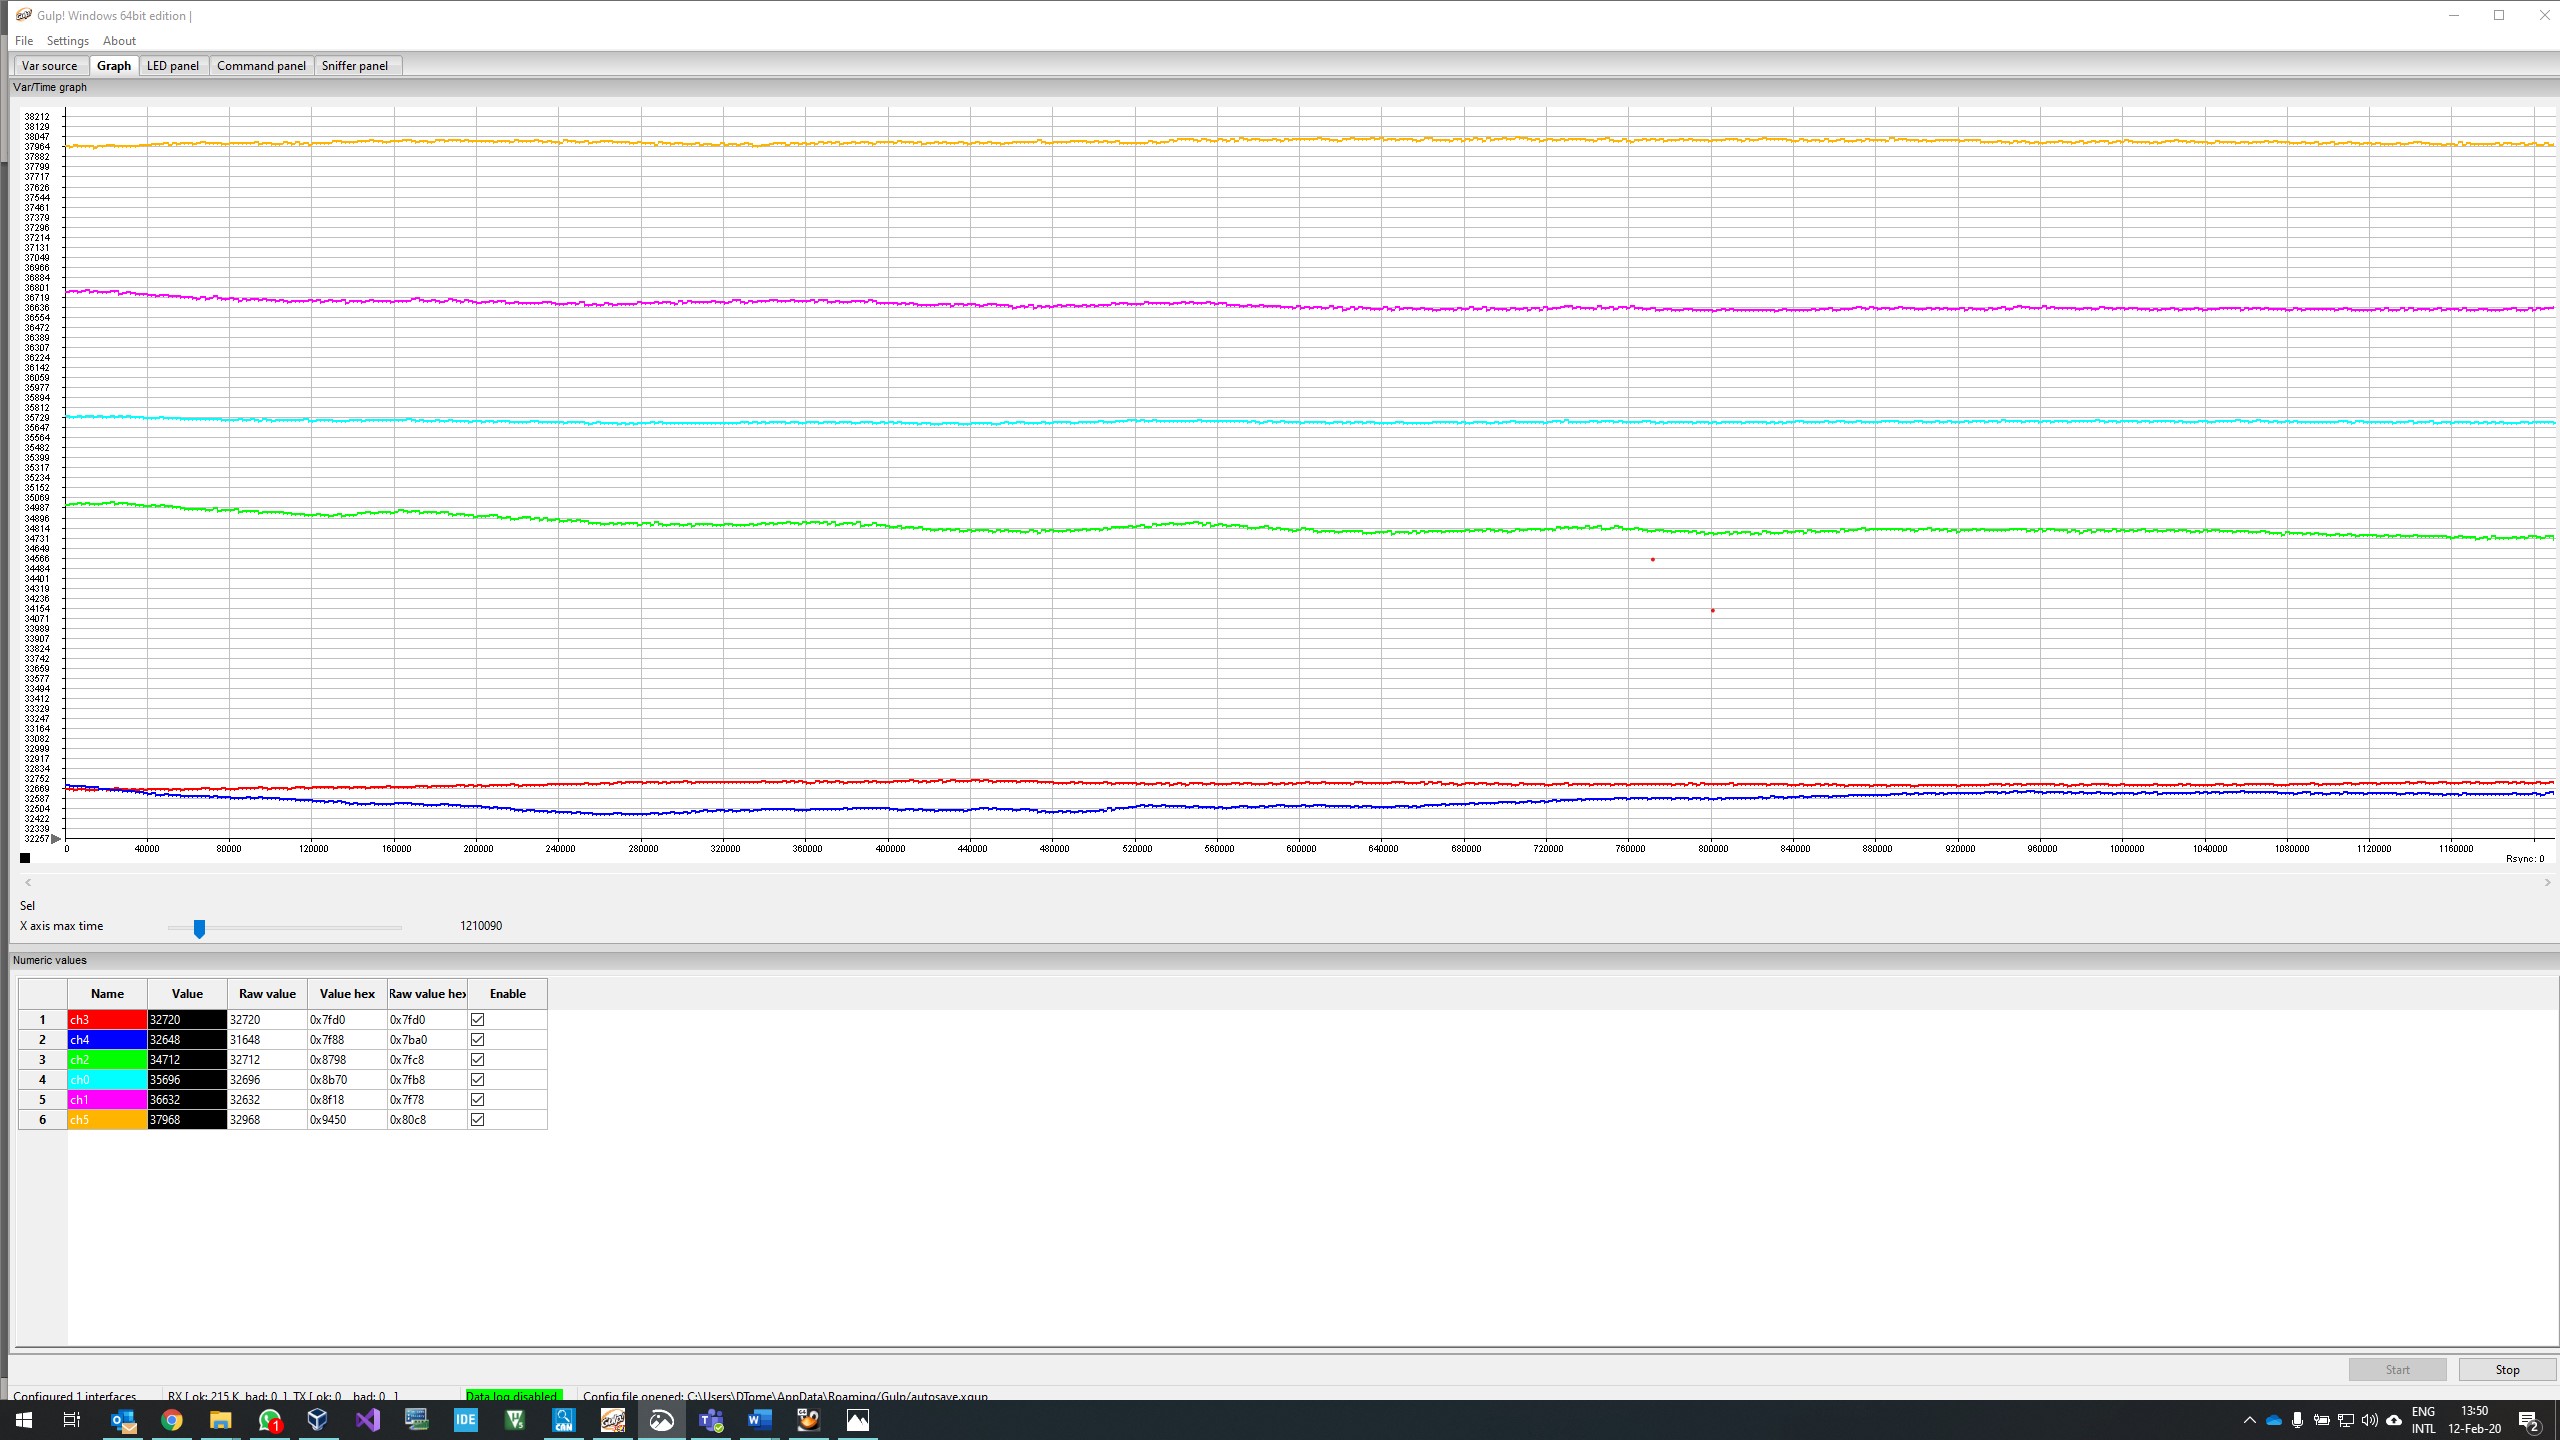
Figure 23 ________________________________________________________________________________________________
- Refer to the picture (Figure 24) take the sensor in your hands , and moving your hands as described in the table you have to see lines moving (figure 25 )
Warning
if it did not happen DO NOT CONTINUE THE CALIBRATION PROCEDURE.
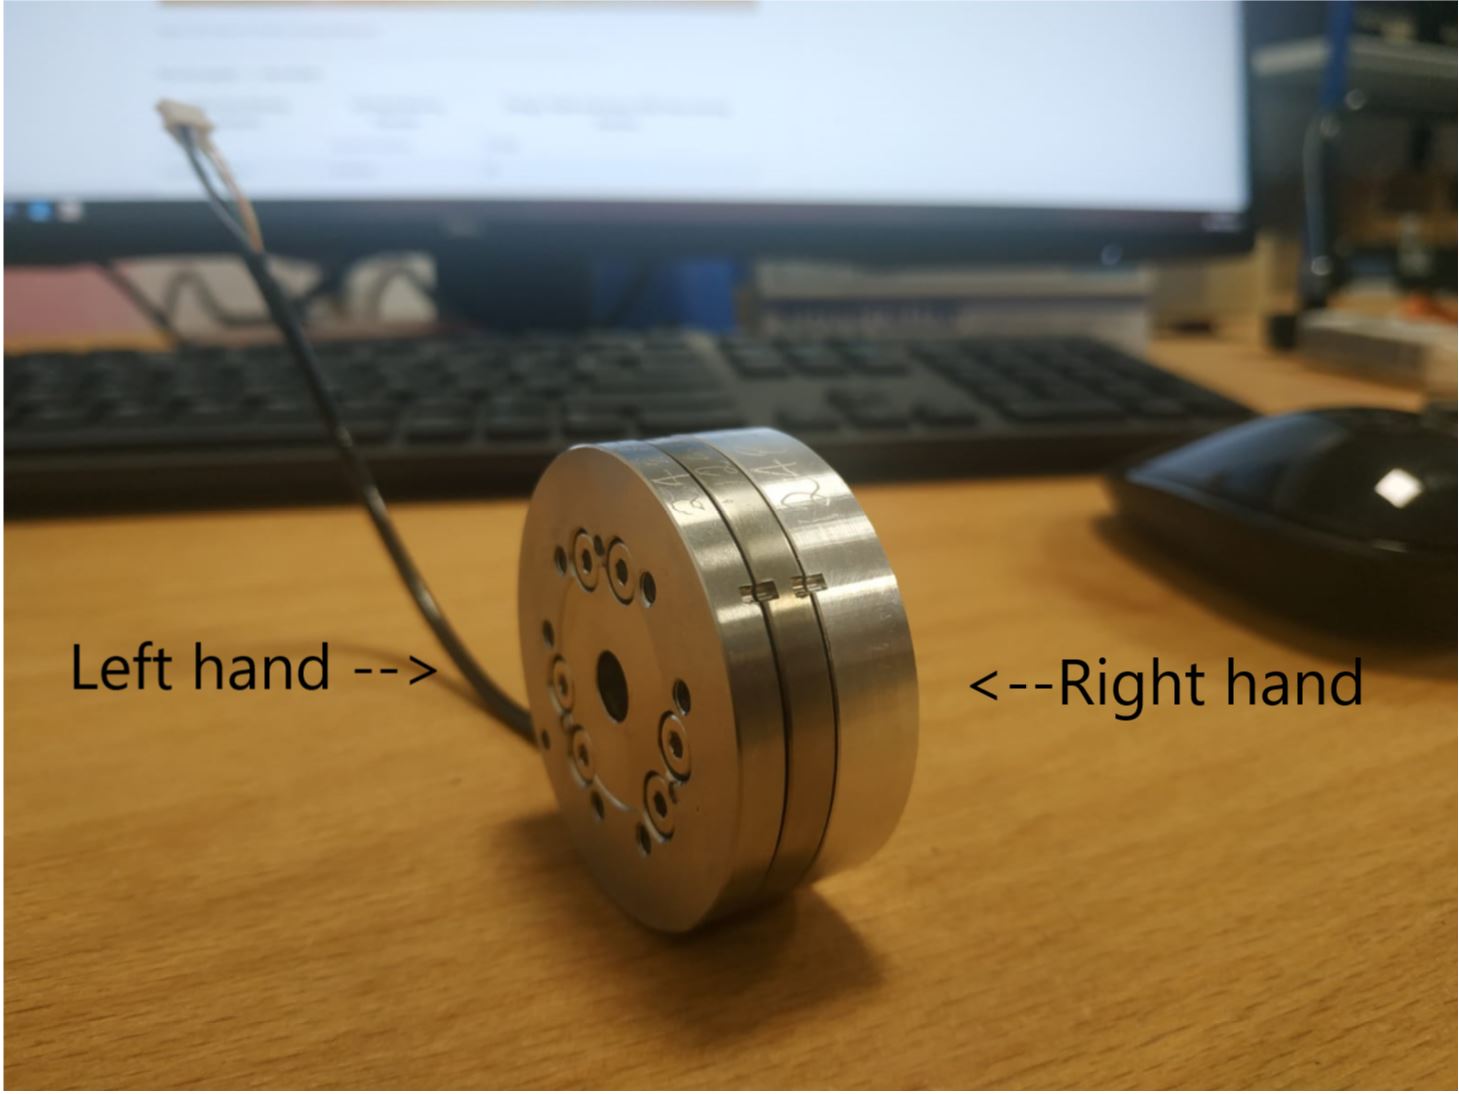
Figure 24: Sensor in hands moving directions ________________________________________________________________________________________________
Foto dei segnali ---> da rivedere
| Right Hand Moving Direction | Left Hand Moving Direction | Orange, Violet and Green GULP lines moving direction |
|---|---|---|
| clockwise | counterclockwise | DOWN |
| counterclockwise | clockwise | UP |
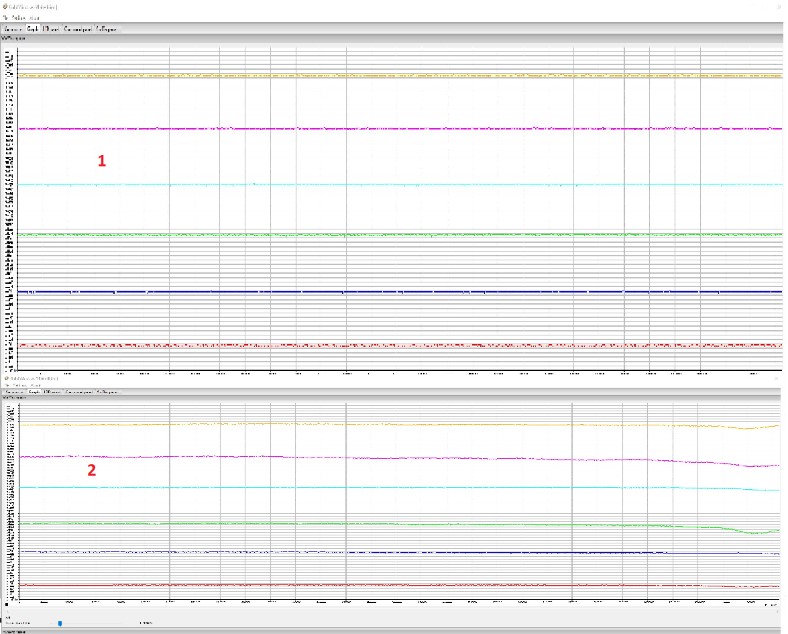
Figure 25 ________________________________________________________________________________________________ Upper figure(1): start_situation ____ Lower figure(2): after_clockwise operation
- Click on “Stop” button both in the “Gulp” and “CanReal” applications
- Close both the applications
4 Calibration Setup Assembly
1) Assembly H1 to the sensor using SC2 screws as follow
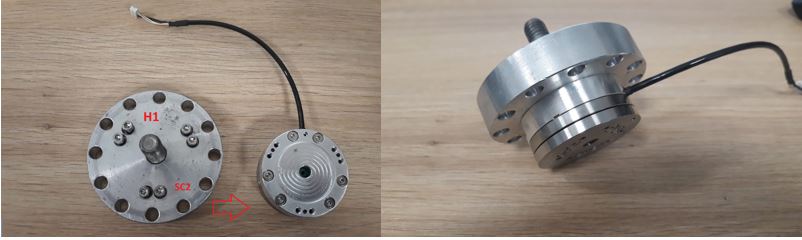
Figure 26: H1 head assembly
2) Place the sensor on the bracket BR1 as follow
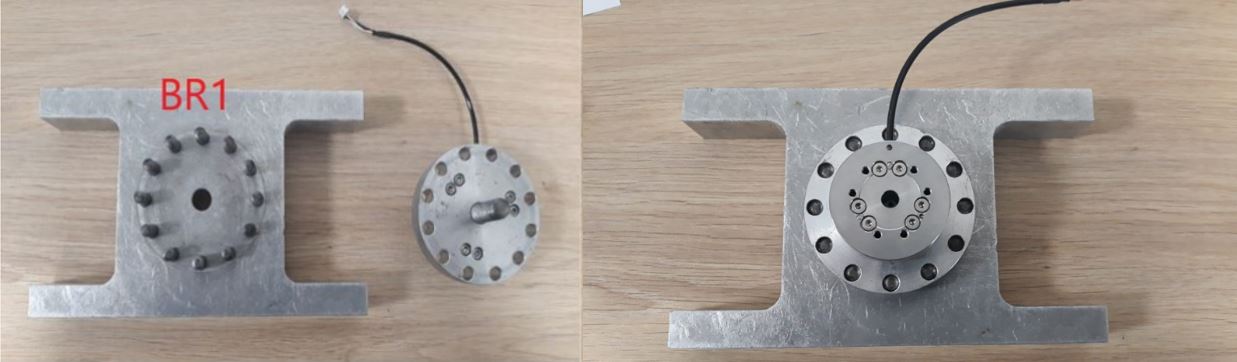
Figure 27: BR1 bracket assembly
3) Assembly the cross CR1 to the sensor using SC1 screws and N1 nut taking care that the sensor cable is in the “X-“ label direction as follow
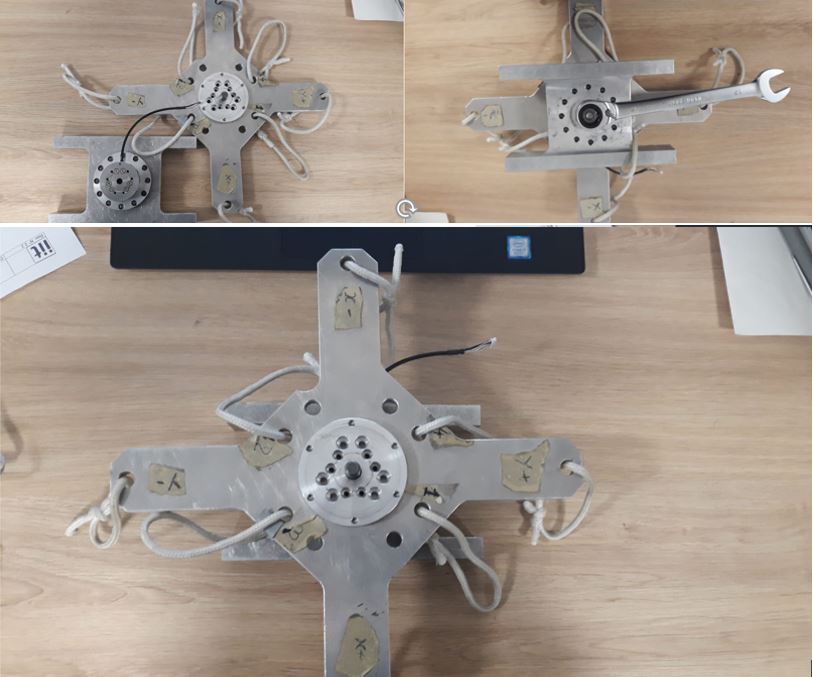
Figure 28: Cr1 cross assembly
5 Sensor Calibration Procedure
Warning
Handle with care the loads and wear accident prevention shoes for your safety!
- Open the Virtual Machine (user "icub", pw "icub") and check that the ESD USB-CAN is attached to it (see figure 29)

Figure 29
________________________________________________________________________________________________
-
Open a terminal in the VM (CTRL+ALT+T) and run “setEsdCan.sh” (it enables the ESD USB-CAN linux driver)
-
Check that the folder /home/icub/data exists
-
Open a terminal in the VM (CTRL+ALT+T) and run “FirmwareUpdater -a” (it opens the FirmwareUpdtaer GUI) then select “SOCKETCAN<0>” as device and click on Discover button (see Figure 30)
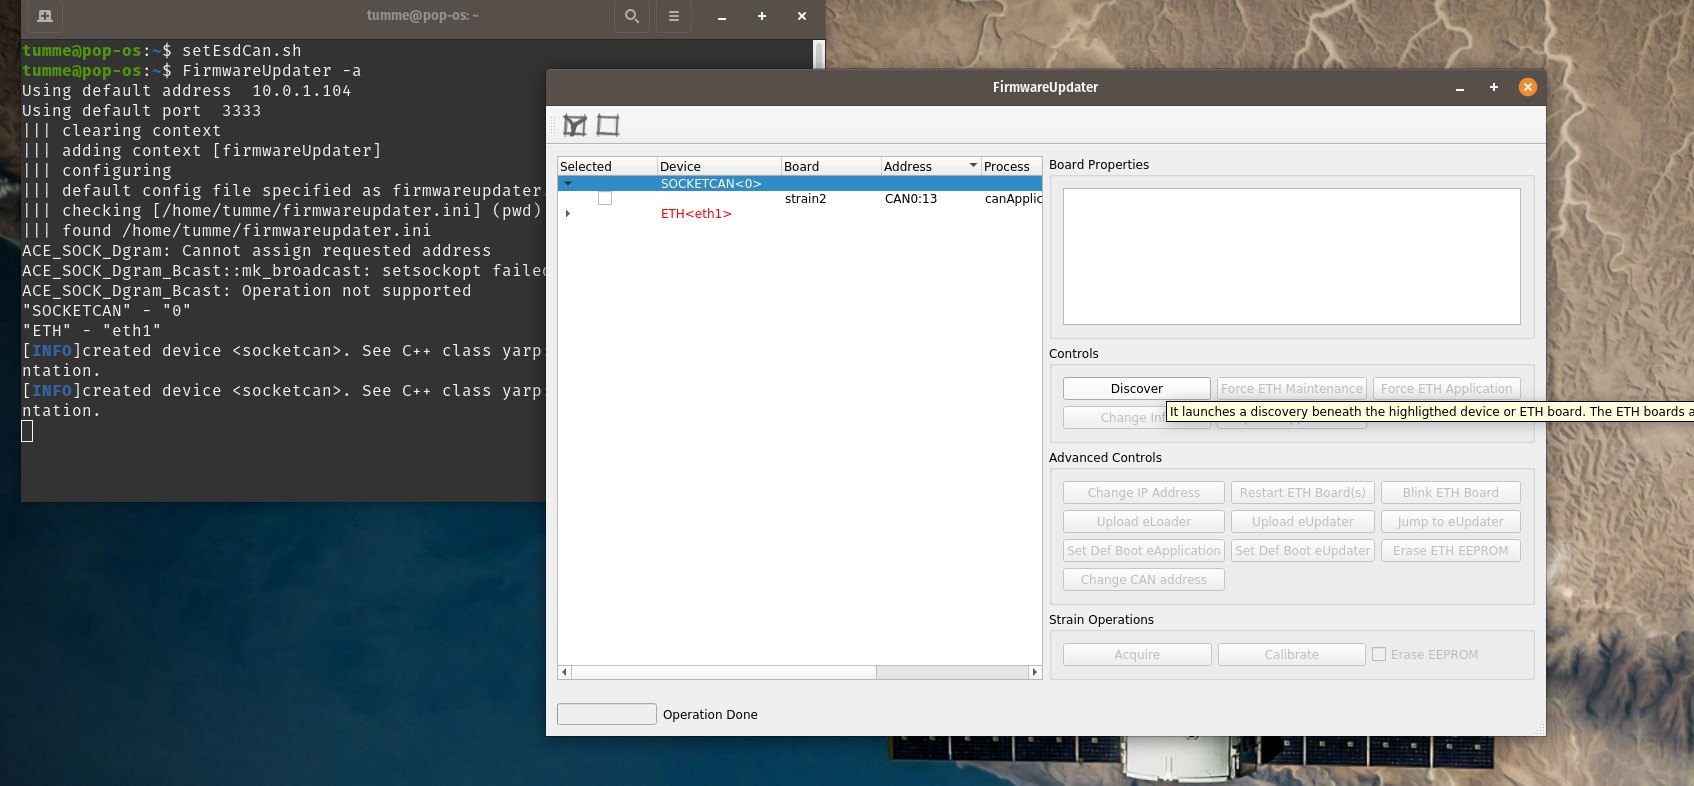 Figure 30
________________________________________________________________________________________________
1) Select the strain2 and click on Acquire (see figure 31)
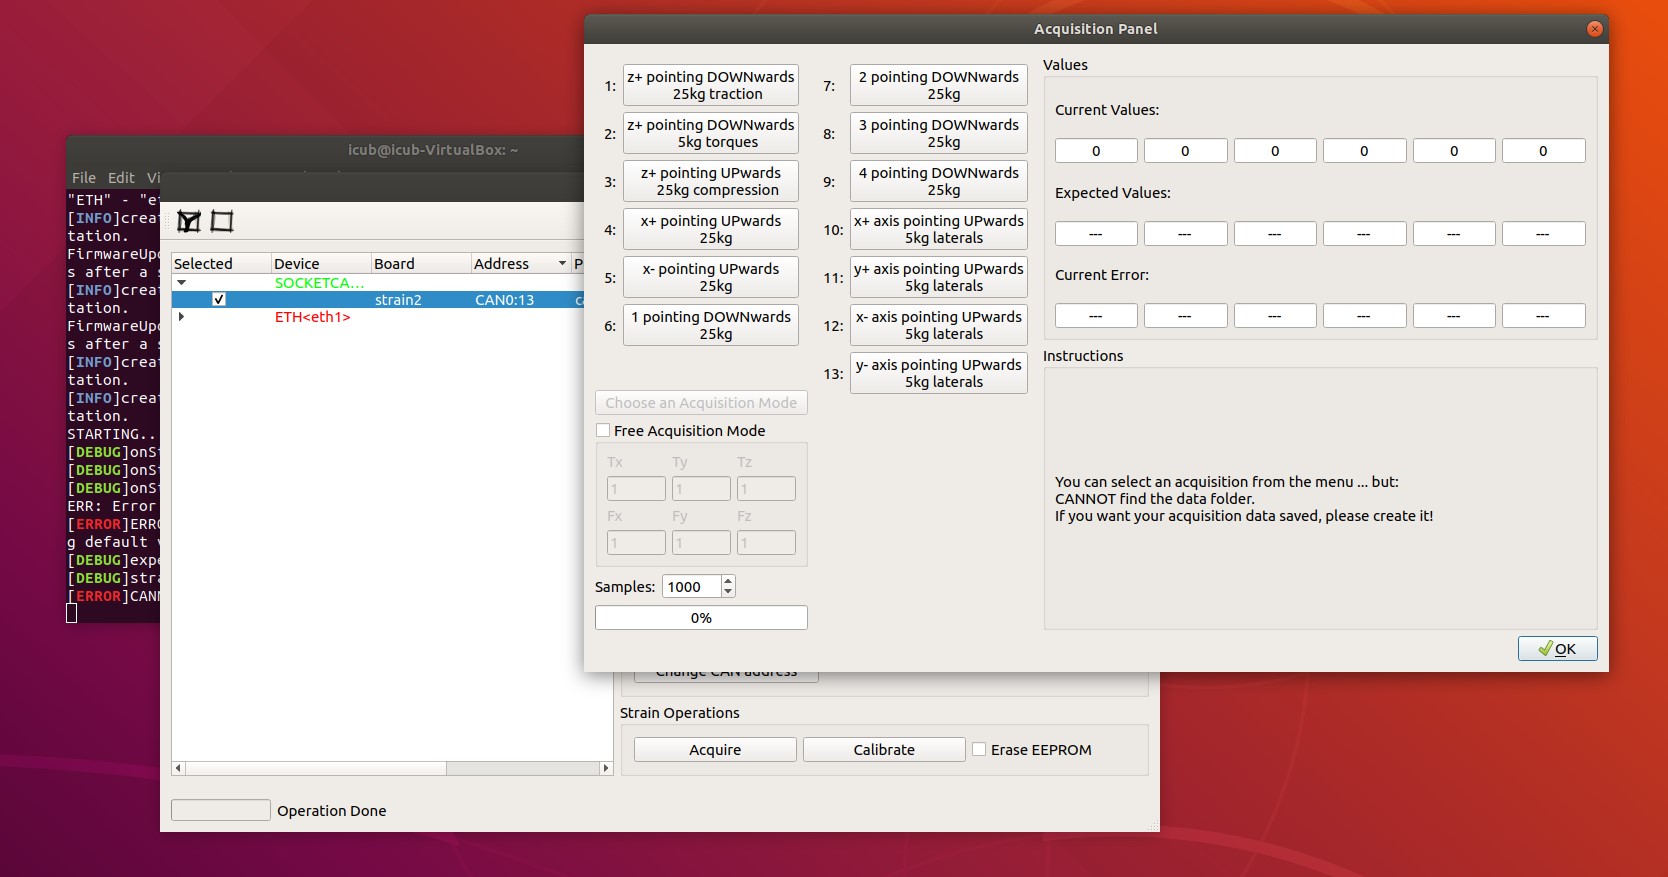
Figure 31
________________________________________________________________________________________________
- Follow the steps from 1 to 13 to complete data acquisition (Each step gives you instructions about the setup configuration - figure 32)
5.1 Z+ pointing downwards 25kg traction
- Click on button concerning step 1
- Place the setup with the Z+ axis pointing downwards with EXT2 Z axis extension mounted, without loads and press “Acquire data” button (as shown on figure 32)
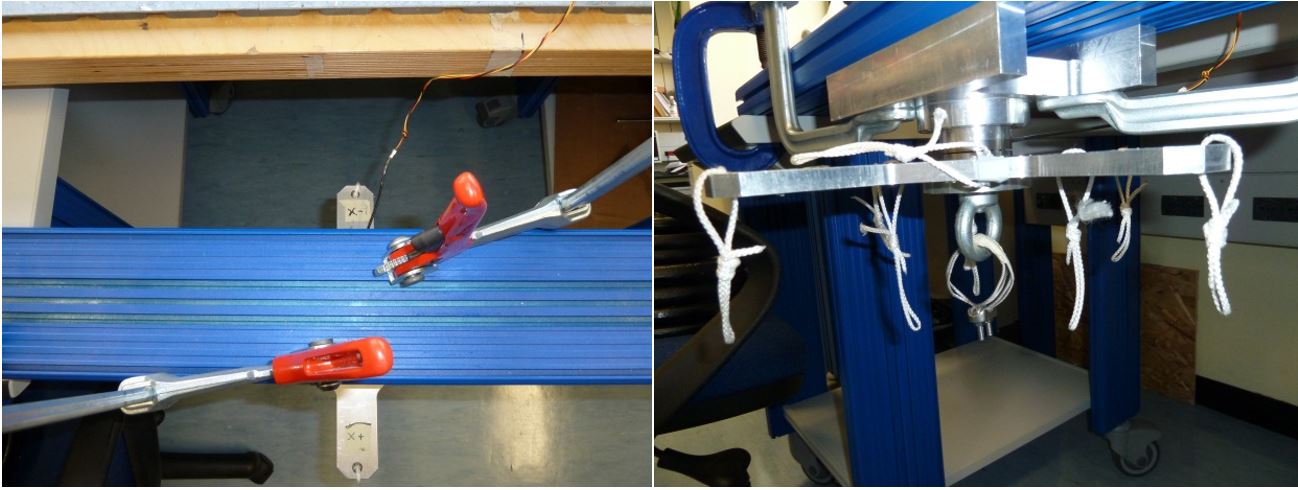
Figure 32: Setup Configuration ________________________________________________________________________________________________
· Place a 25Kg load on the z+ axis , wait till the load is stable (not swing) and check the numbers in the window. They must be all in green, if not take note of strange values in the report.
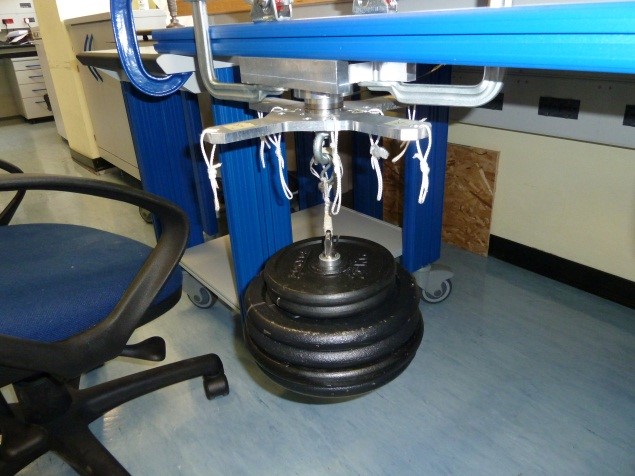
Figure 33: Load Configuration
________________________________________________________________________________________________
- Press “Acquire data” button and remove the load
5.2 Z+ pointing downwards 5kg torques
-
Click on button concerning step 2
-
Place the setup with the Z+ axis pointing downwards without EXT2 Z axis extension, without loads and press “Acquire data” button (see figure 34)
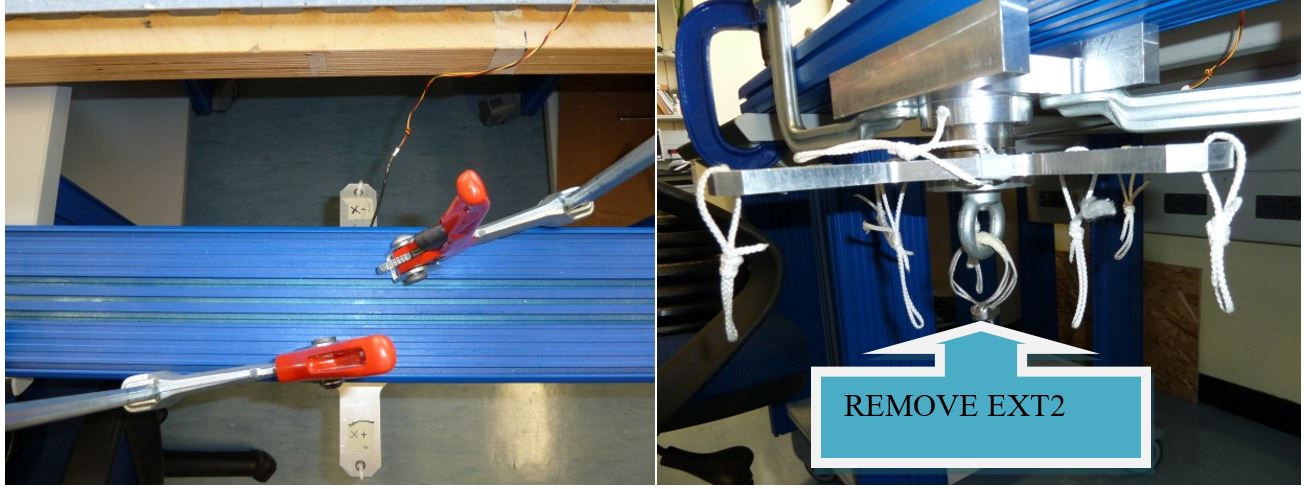
Figure 34: Setup Configuration _________________________________________________________________________________________________
- Following the window instructions place a 5Kg load on the “Y-“ axis (and then for the other 3 axes), wait that the load is stable (not swing) and check the numbers in the window. They must be all in green, if not take note of strange values in the report
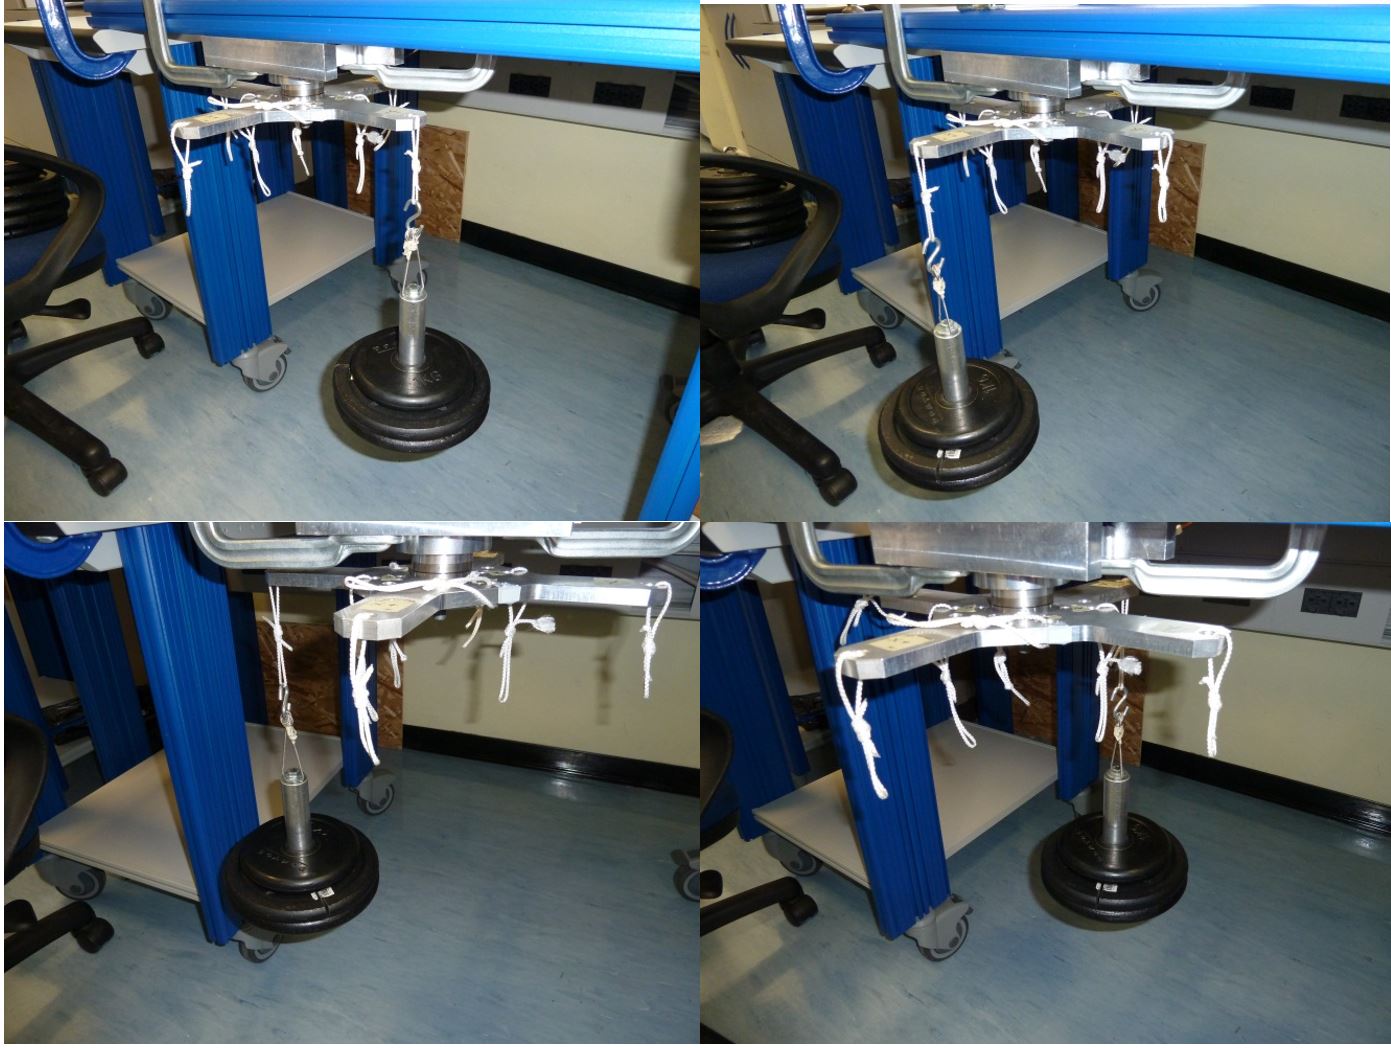
Figure 35: Load Configuration ________________________________________________________________________________________________
- Press Acquire data button and remove the load
5.3 Z+ pointing upwards 25kg compression
-
Click on button concerning step 3
-
Place the setup with the Z+ axis pointing upwards with EXT1 Z axis extension mounted , without loads and press “Acquire data” button (see figure 36)
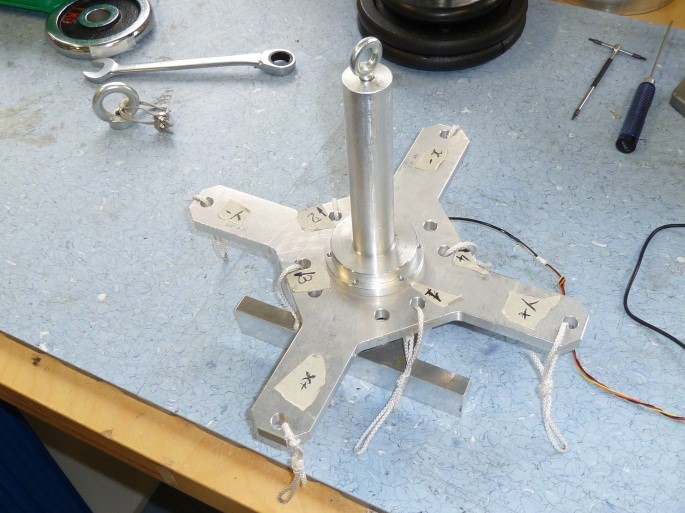
Figure 36: Setup Configuration ________________________________________________________________________________________________
- Following the window instructions place a 25Kg load on the “Z+“ axis and check the numbers in the window. They must be all in green, if not take note of strange values in the report
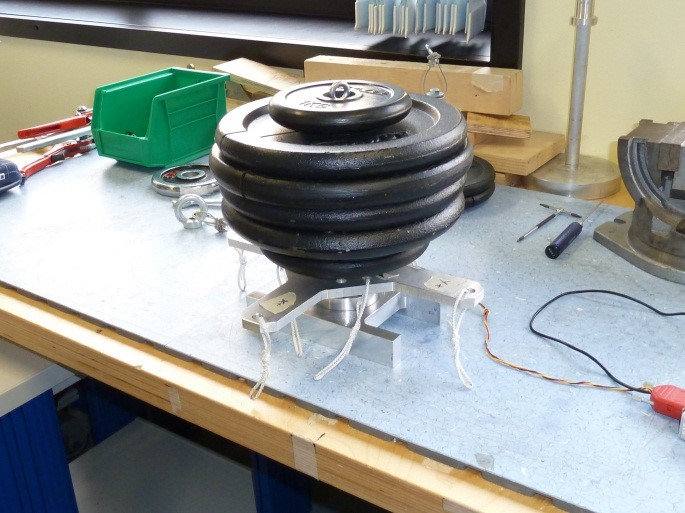
Figure 37: Load configuration
-
Press “Acquire data” button and remove the load
-
Fill in the respective calibration report field
5.4 X+ pointing upwards 25kg
-
Click on button concerning step 4
-
Place the setup with the X+ axis pointing upwards without loads and press “Acquire data” button as shown below
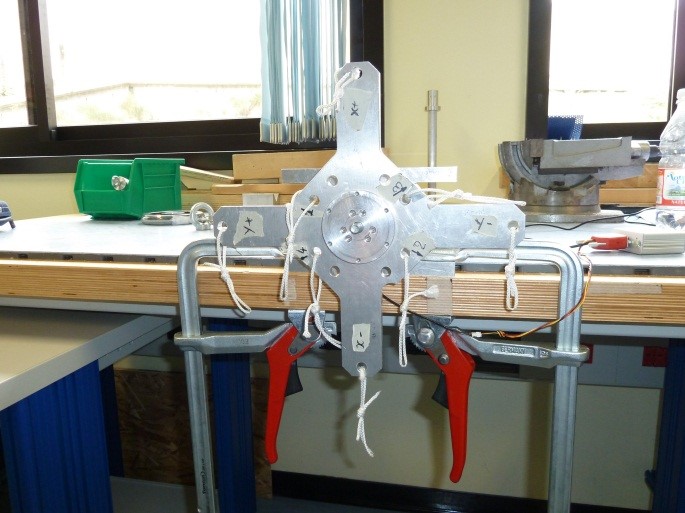
Figure 38: Setup Configuration ________________________________________________________________________________________________
- Following the window instructions place a 25Kg load on the “X-“ axis , wait that the load is stable (not swing) and check the numbers in the window. They must be all in green, if not take note of strange values in the report
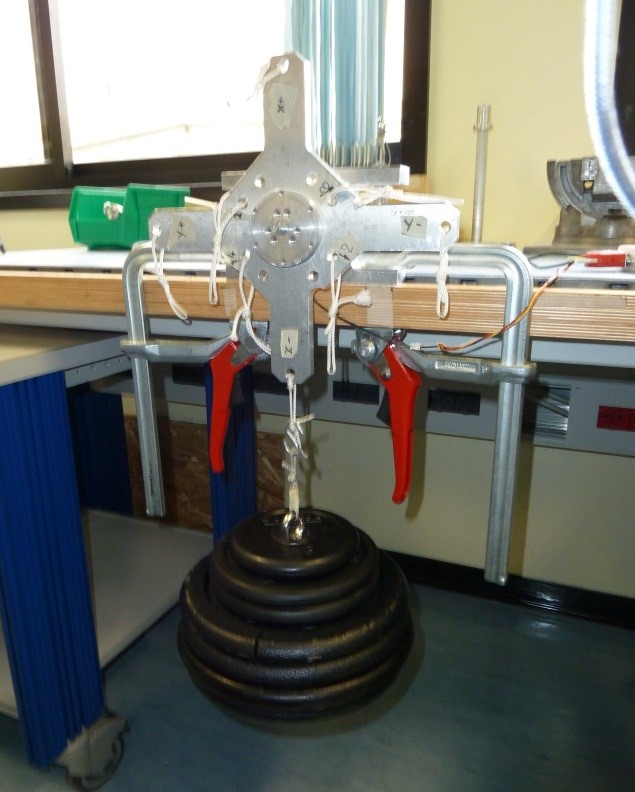
Figure 39: Load configuration
________________________________________________________________________________________________
-
Press “Acquire data” button and remove the load
-
Fill in the respective calibration report field
5.5 X- pointing upwards 25kg
-
Click on button concerning step 5
-
Place the setup with the X- axis pointing upwards without loads and press “Acquire data” button (see figure 40)
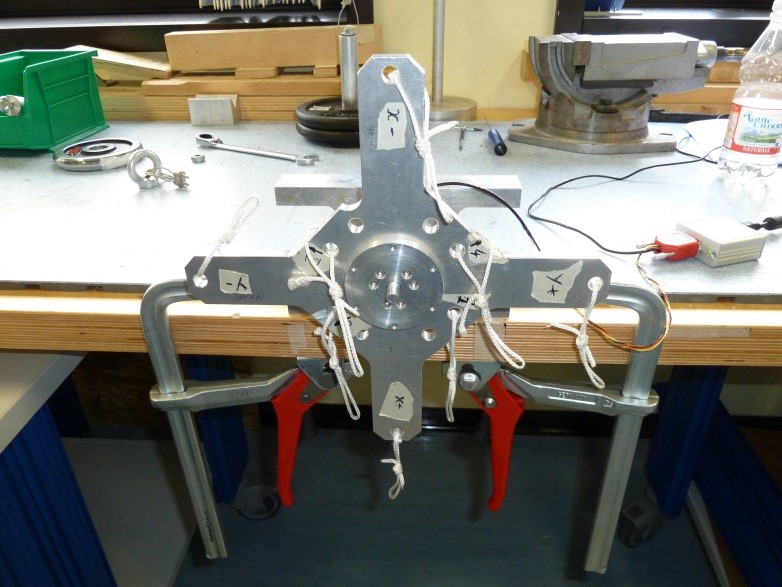
Figure 40: Setup Configuration ________________________________________________________________________________________________
- Following the window instructions place a 25Kg load on the “X+“ axis , wait that the load is stable (not swing) and check the numbers in the window. They must be all in green, if not take note of strange values in the report
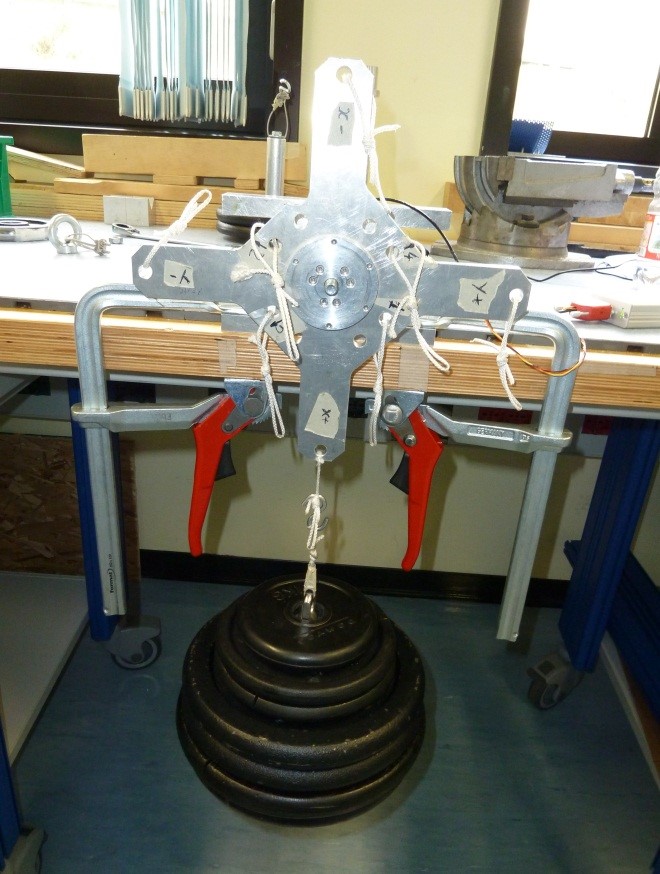
Figure 41: Load configuration ________________________________________________________________________________________________
-
Press “Acquire data” button and remove the load
-
Fill in the respective calibration report field
5.6 “1” pointing downwards 25kg
-
Click on button concerning step 6
-
Place the setup with the label “1” pointing downwards without loads and press “Acquire data” button (see figure 42)
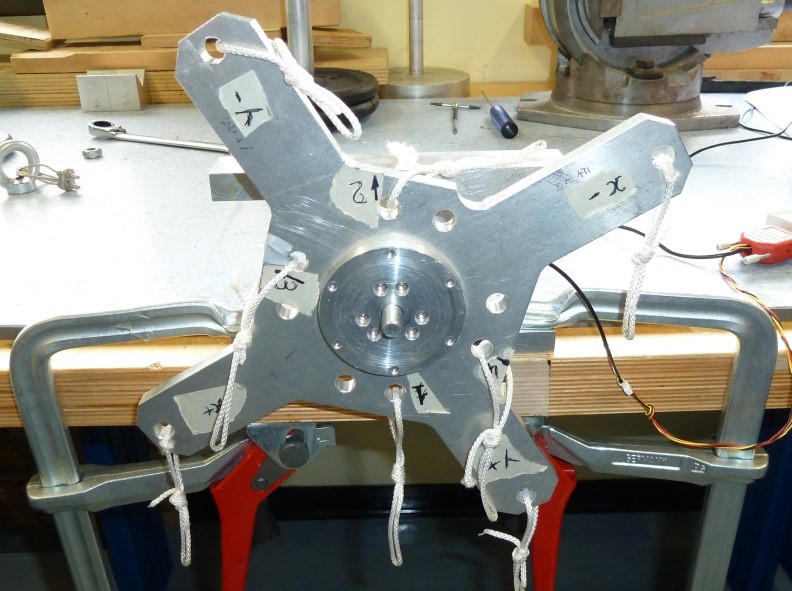
Figure 42: Setup Configuration ________________________________________________________________________________________________ - Following the window instructions place a 25Kg load on the “1“ label , wait that the load is stable (not swing) and check the numbers in the window. They must be all in green, if not take note of strange values in the report
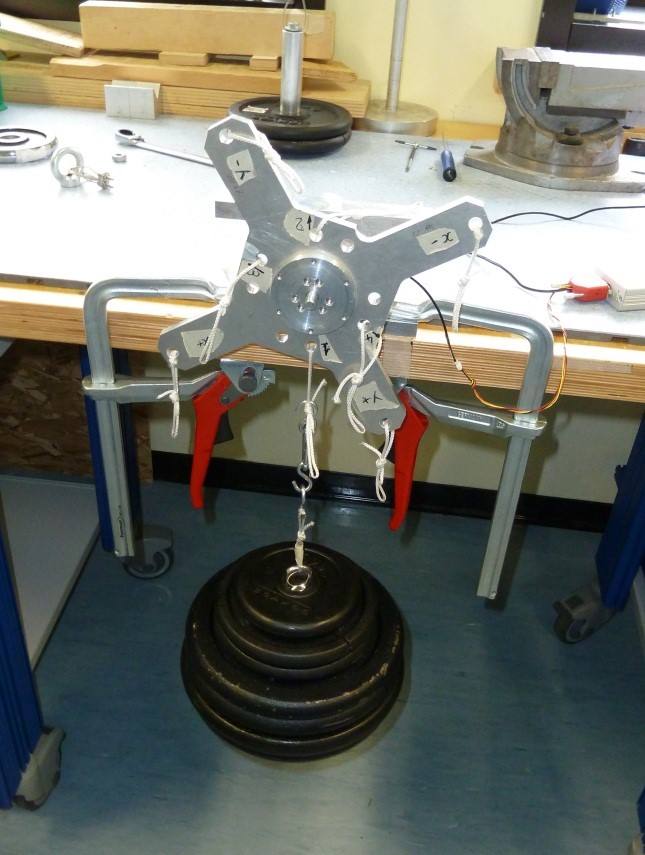
Figure 43: Load configuration ________________________________________________________________________________________________
-
Press “Acquire data” button and remove the load
-
Fill in the respective calibration report field
5.7 “2” pointing downwards 25kg
-
Click on button concerning step 7
-
Place the setup with the label “2” pointing downwards without loads and press “Acquire data” button (see figure 44)
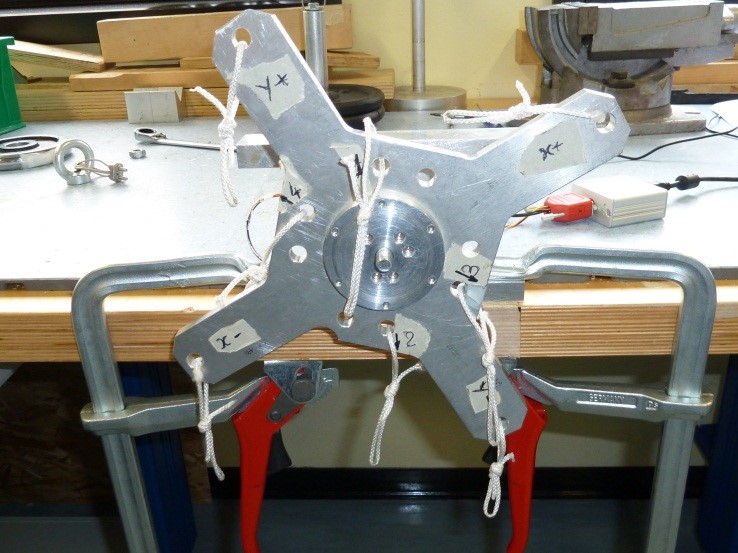
Figure 44: Setup Configuration ________________________________________________________________________________________________
- Following the window instructions place a 25Kg load on the “2“ label, wait that the load is stable (not swing) and check the numbers in the window. They must be all in green, if not take note of strange values in the report
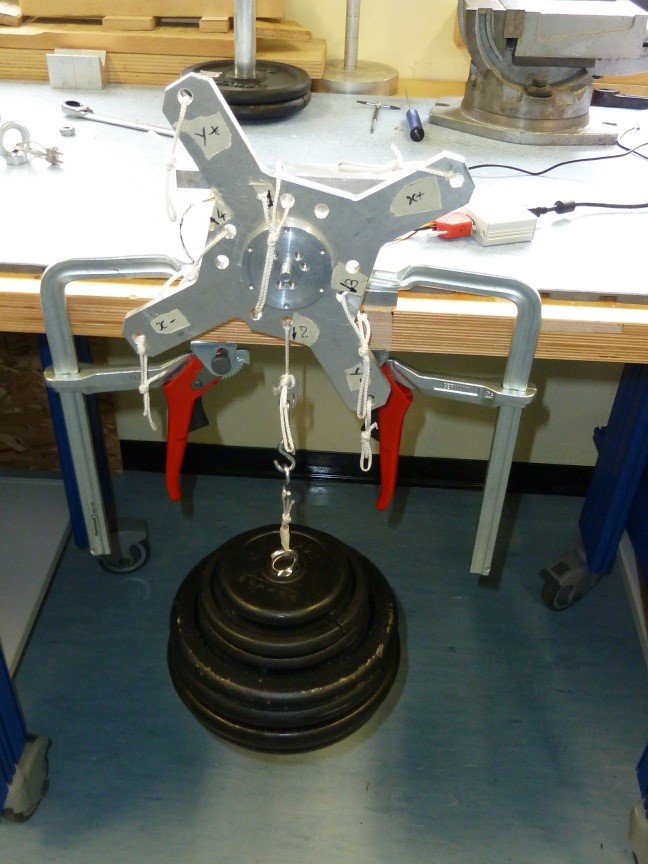
Figure 45: Load configuration ________________________________________________________________________________________________
- Press “Acquire data” button and remove the load
- Fill in the respective calibration report field
5.8 “3” pointing downwards 25kg
-
Click on button concerning step 8
-
Place the setup with the label “3” pointing downwards without loads and press “Acquire data” button (see fig 46)
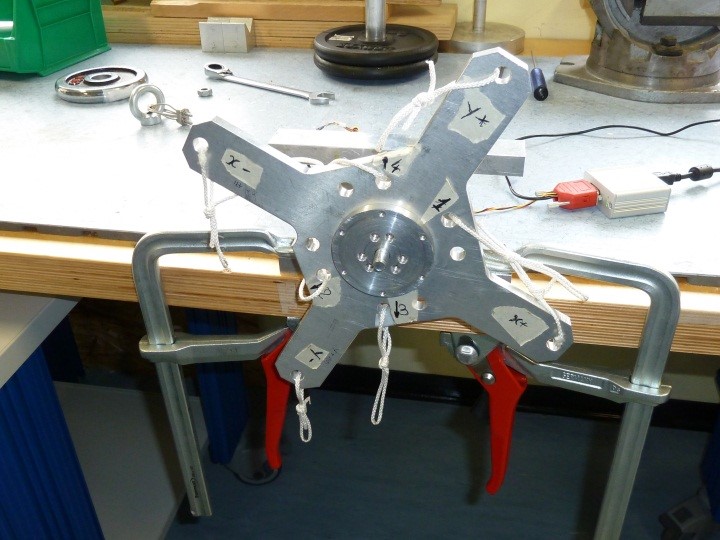
Figure 46: Setup Configuration ________________________________________________________________________________________________ - Following the window instructions place a 25Kg load on the “3“ label ,wait that the load is stable (not swing) and check the numbers in the window. They must be all in green, if not take note of strange values in the report
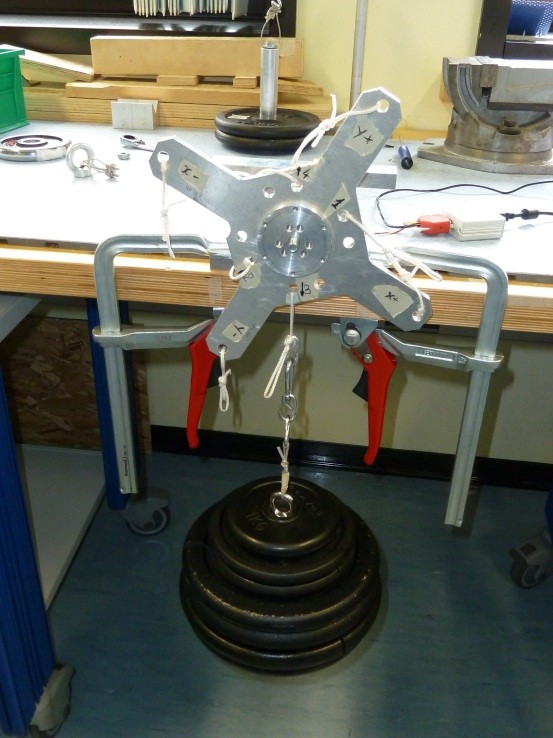
Figure 47: Load configuration ________________________________________________________________________________________________
- Press “Acquire data” button and remove the load
- Fill in the respective calibration report field
5.9 “4” pointing downwards 25kg
-
Click on button concerning step 9
-
Place the setup with the label “4” pointing downwards without loads and press “Acquire data” button (see figure 48)
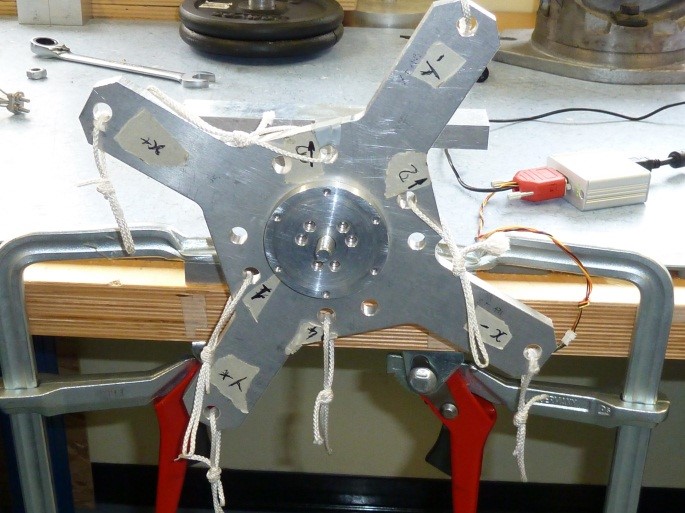
Figure 48: Setup Configuration ________________________________________________________________________________________________ - Following the window instructions place a 25Kg load on the “4“ label, wait that the load is stable (not swing) and check the numbers in the window. They must be all in green, if not take note of strange values in the report
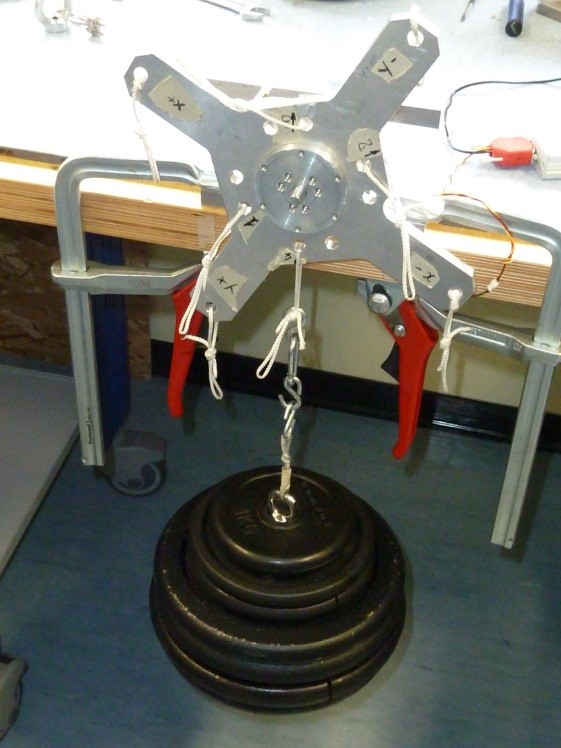
Figure 49: Load configuration ________________________________________________________________________________________________
- Press “Acquire data” button and remove the load
- Fill in the respective calibration report field
5.10 X+ pointing upwards 5kg laterals
- Click on button concerning step 10
- Place the setup with the axis “X+” pointing upwards with the EXT1 Z axis extension mounted, without loads and press “Acquire data” button (see figure 50)
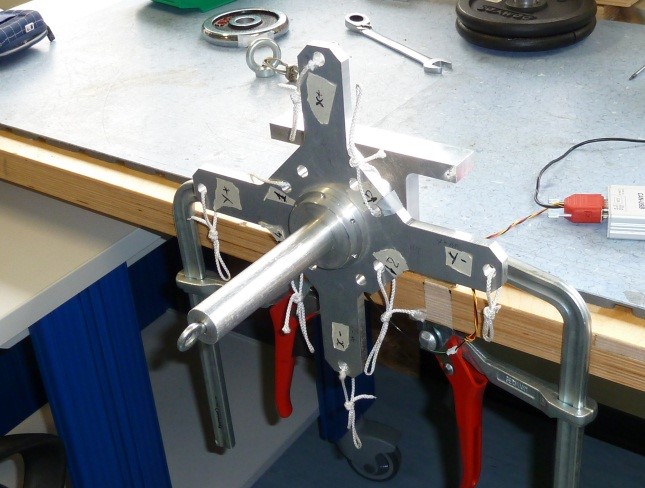
Figure 50: Setup Configuration ________________________________________________________________________________________________
- Following the window instructions place a 5Kg load on the Y- axis (then on the Z+ and Y+ axes), wait that the load is stable (not swing) and check the numbers in the window. They must be all in green, if not take note of strange values in the report
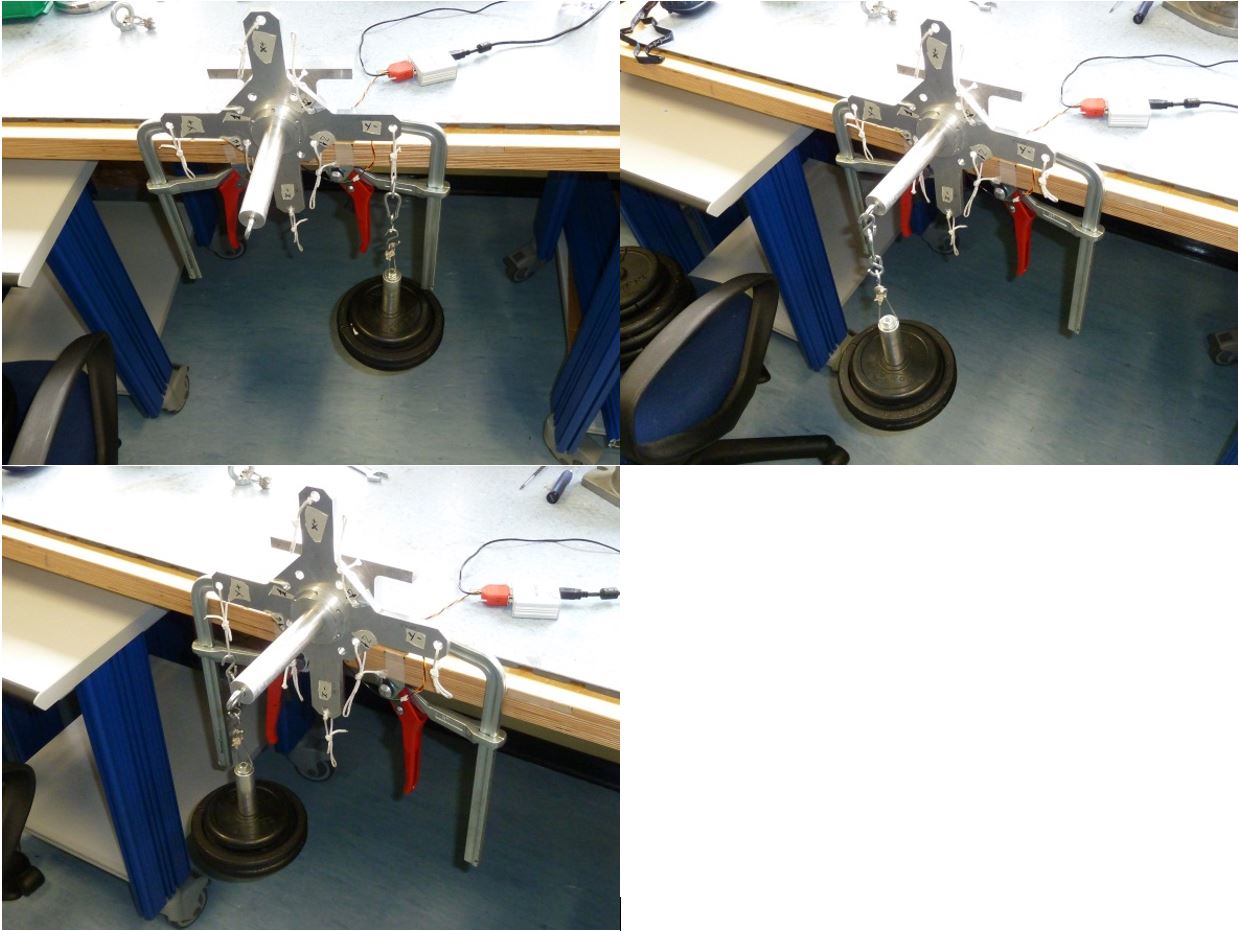
Figure 51: Load configurations (3x)
________________________________________________________________________________________________
- Press “Acquire data” button and remove the load
- Fill in the respective calibration report field
5.11 Y+ pointing upwards 5kg laterals
- Click on button concerning step 11
- Place the setup with the axis “Y+” pointing upwards with the EXT1 Z axis extension mounted, without loads and press “Acquire data” button (see figure 52)
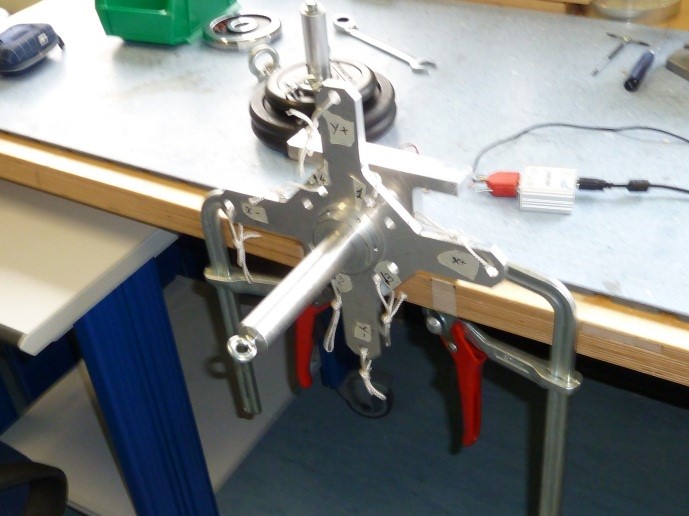
Figure 52: Setup Configuration ________________________________________________________________________________________________
- Following the window instructions place a 5Kg load on the X+ axis (then on the Z+ and X- axes), wait that the load is stable (not swing) and check the numbers in the window. They must be all in green, if not take note of strange values in the report
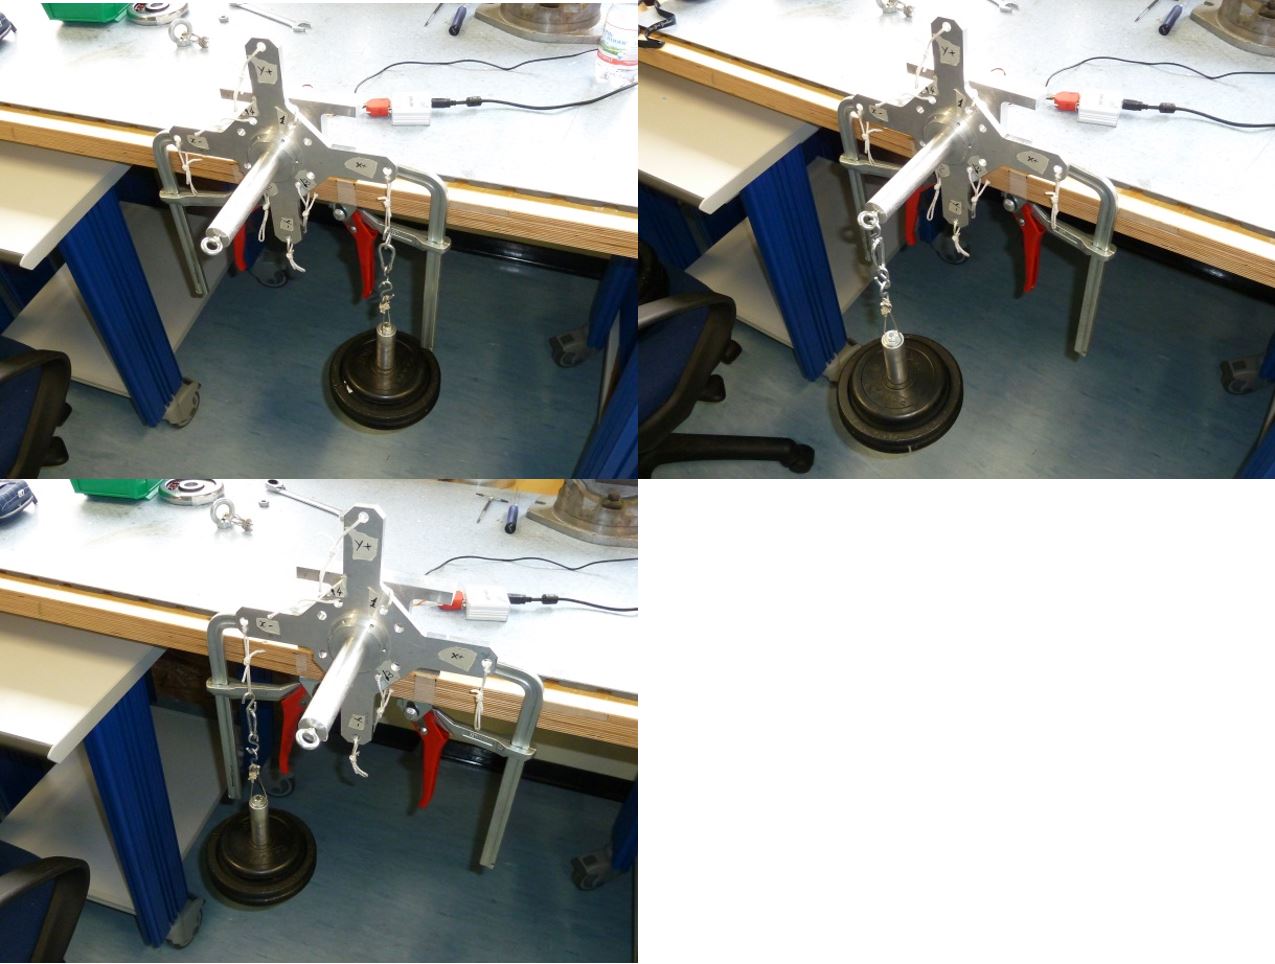
Figure 53: Load configurations (3x)
- Press “Acquire data” button and remove the load
- Fill in the respective calibration report field
5.12 X- pointing upwards 5kg laterals
- Click on button concerning step 12
- Place the setup with the axis “X-” pointing upwards with the EXT1 Z axis extension mounted, without loads and press “Acquire data” button (see figure 54)
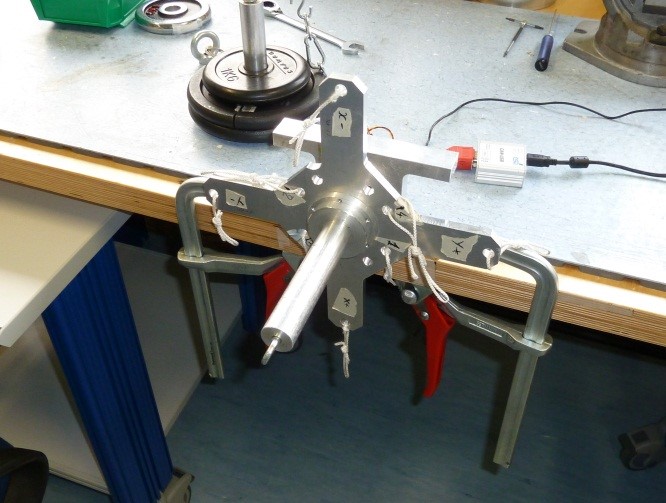
Figure 54: Setup Configuration ________________________________________________________________________________________________
- Following the window instructions place a 5Kg load on the Y+ axis (then on the Z+ and Y- axes), wait that the load is stable (not swing) and check the numbers in the window. They must be all in green, if not take note of strange values in the report
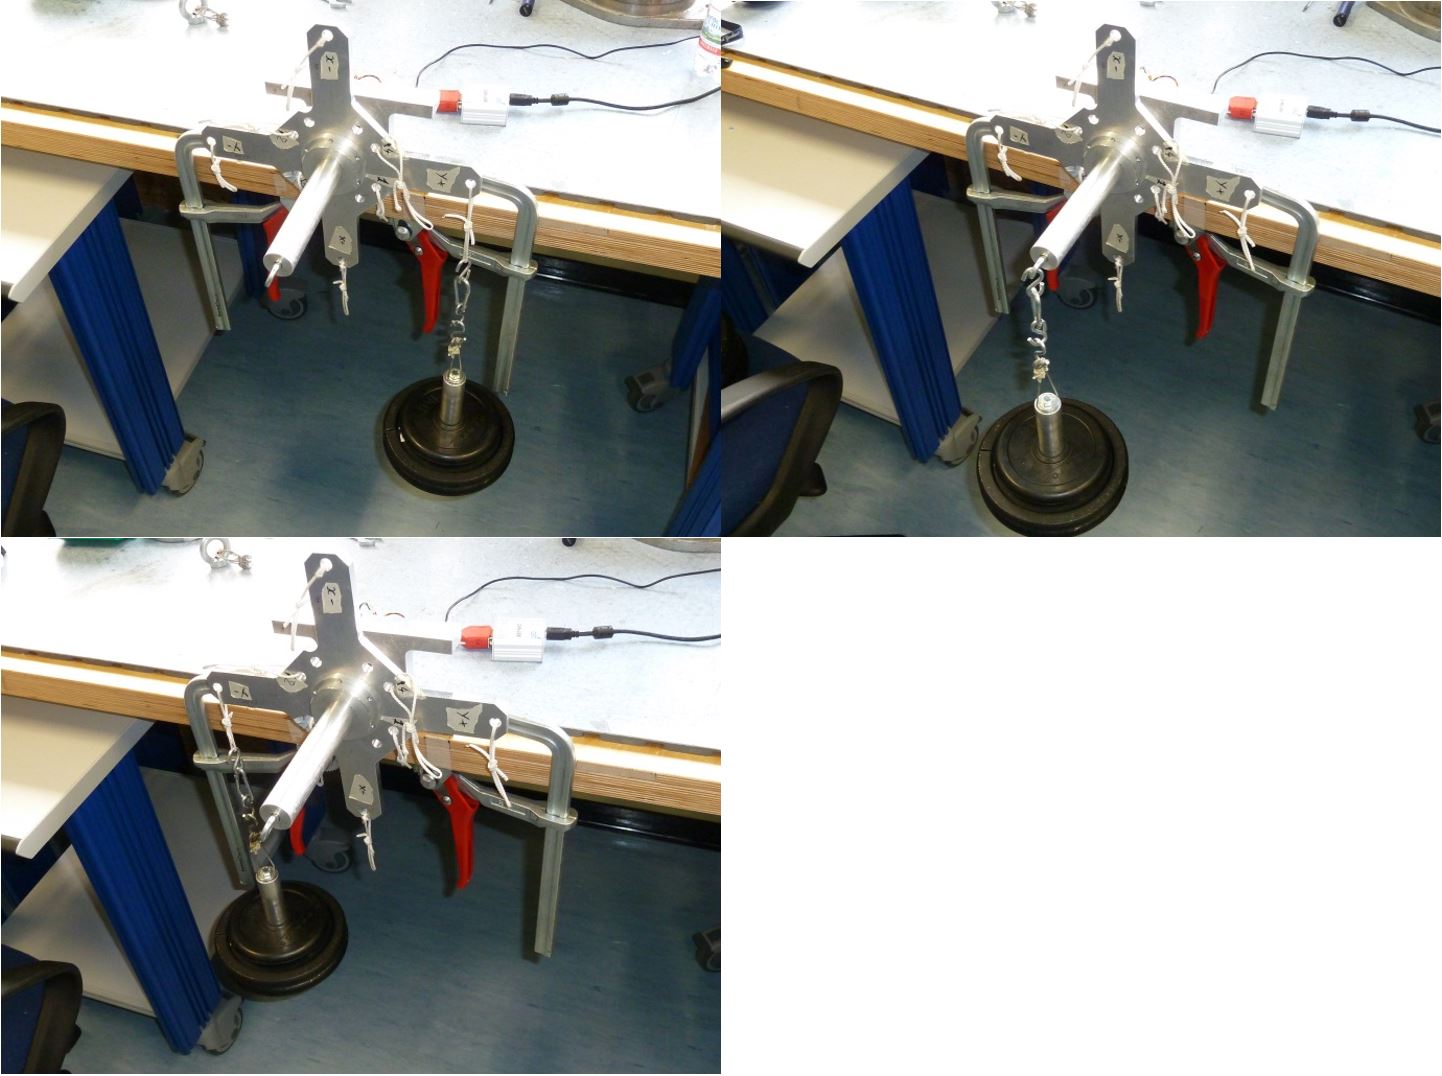
Figure 55: Load configurations (3x) ________________________________________________________________________________________________
- Press “Acquire data” button and remove the load
- Fill in the respective calibration report field
5.13 Y- pointing upwards 5kg laterals
- Click on button concerning step 13
- Place the setup with the axis “Y-” pointing upwards with the EXT1 Z axis extension mounted, without loads and press “Acquire data” button (see figure 56)
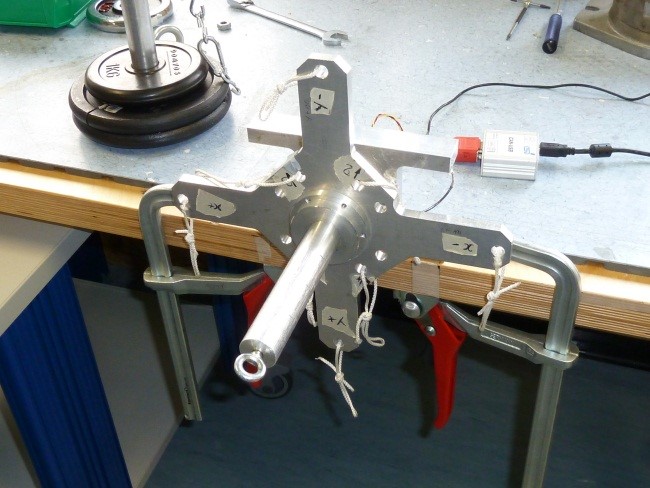 Figure 56: Setup Configuration
________________________________________________________________________________________________
Figure 56: Setup Configuration
________________________________________________________________________________________________
- Following the window instructions place a 5Kg load on the X- axis (then on the Z+ and X+ axes), wait that the load is stable (not swing) and check the numbers in the window. They must be all in green, if not take note of strange values in the report
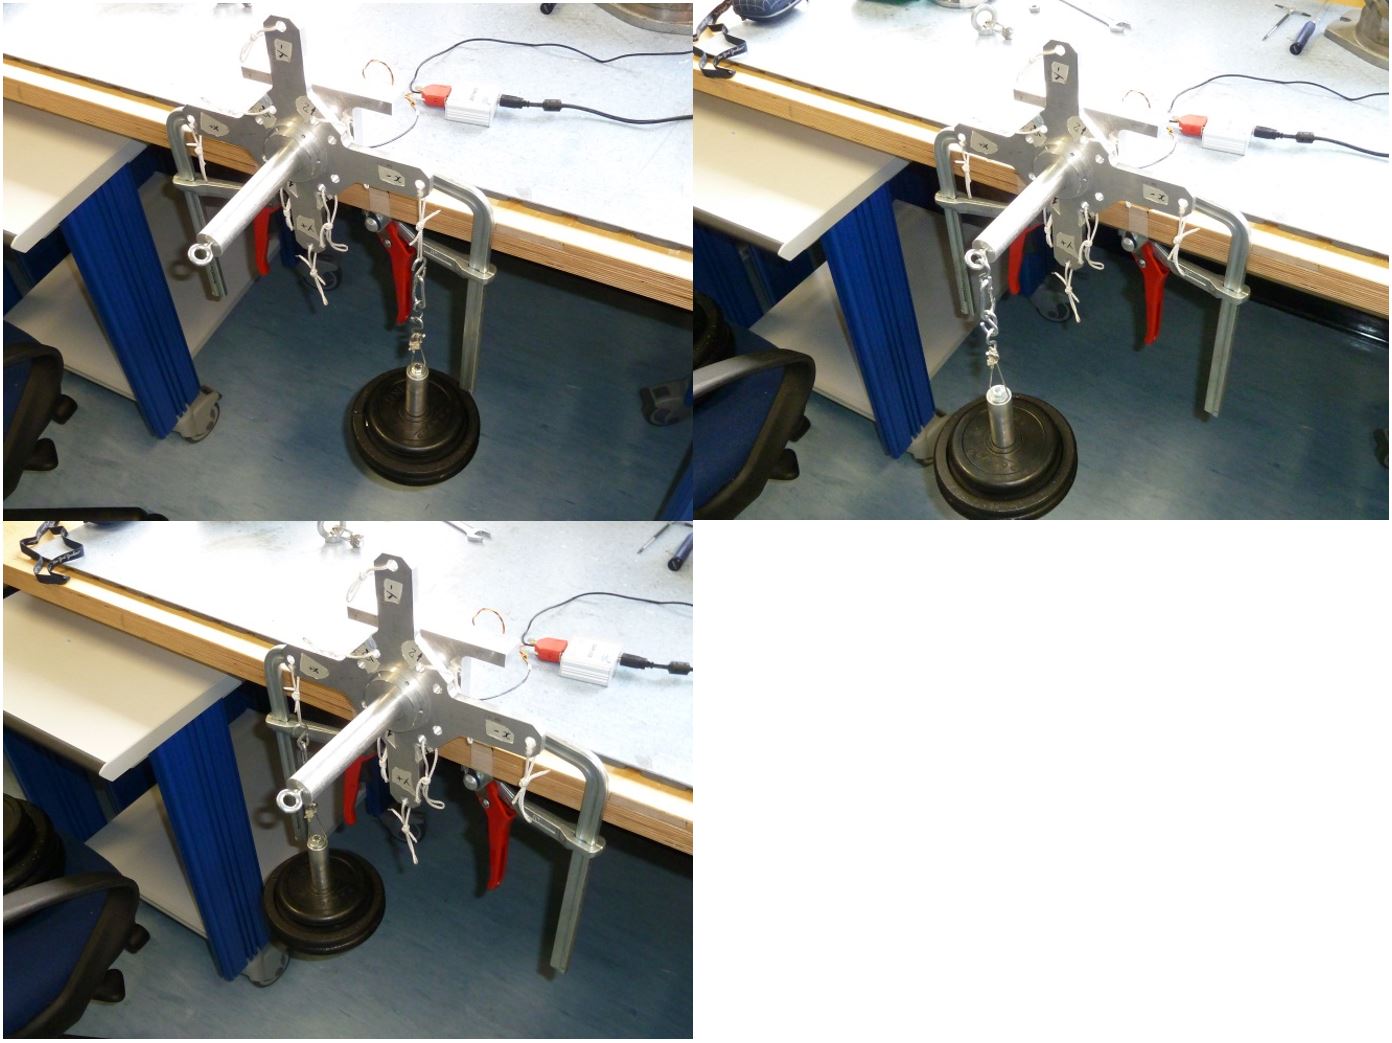
Figure 57: Load configurations ________________________________________________________________________________________________
- Press “Acquire data” button and remove the load
- Fill in the respective calibration report field
6 Generating Calibration Matrix
- Close the FirmwareUpdater application.
- Disassemble the calibration setup from the sensor and keep it connected to the PC
- On the VM create a directory named
/home/icub/calibration-ft-sensors/software/sensAquisitionArchive/cod_iit_XXX/SNXXX
Where ” cod_iit_XXX” and SNXXX are the IIT code folder name and the serial number of the sensor under test.
- Copy all files just generated :
From : /home/icub/data
To : /home/icub/calibration-ft-sensors/software/sensAquisitionArchive/cod_iit_XXX/SNXXX
-
Type cd /home/icub/calibration-ft-sensors/software/sensAquisitionArchive/matlabFiles
-
Type gedit main.m
- Change the sensFolder = cod_iit_xxxx and “sensNum = 'SNxxx'; % sensor to calibrate” statement with your sensor code and serial number and click Save and close (See figure 58)
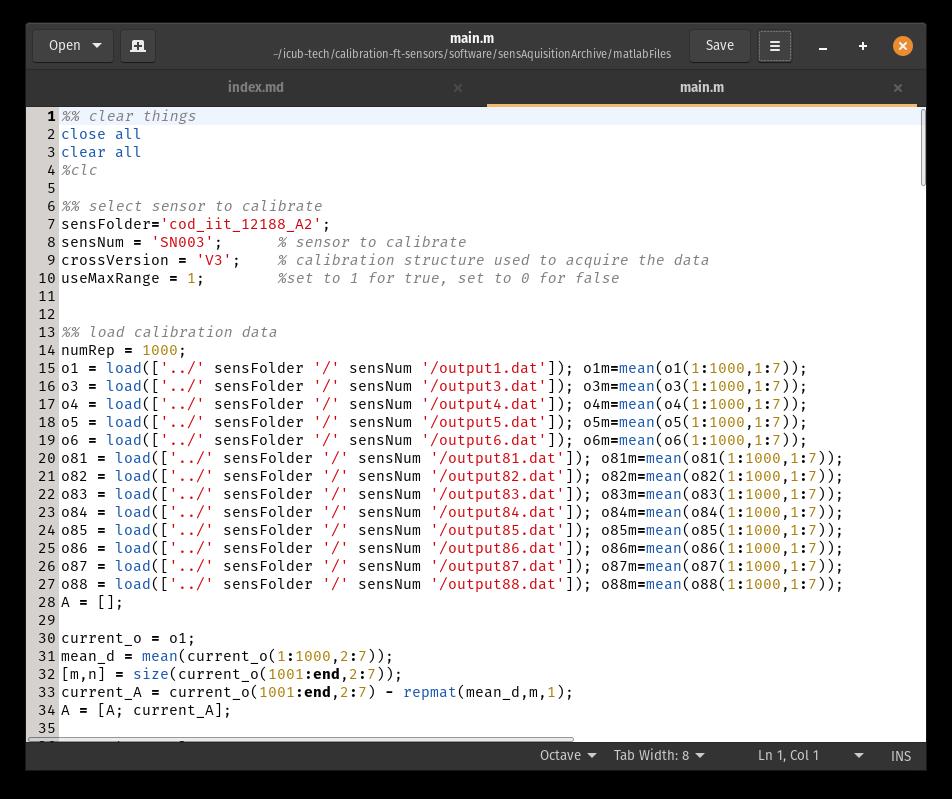 Figure 58
________________________________________________________________________________________________
Figure 58
________________________________________________________________________________________________
- Type octave main.m
- Check if the matrix_SNxxx.txt is present in the sensor folder
- Open a terminal in the VM (CTRL+ALT+T) and run FirmwareUpdater -a (open the FirmwareUpdtaer GUI) then select SOCKETCAN<0> as device and click on Discover button (see figure 59)
 Figure 59
________________________________________________________________________________________________
Figure 59
________________________________________________________________________________________________
- Select the strain2 and click on Calibrate
- Click on Import in Matrix and full scales section and select the matrix_SNXX.txt file just generated
- Click on Send, Tune and check Apply digital regulation
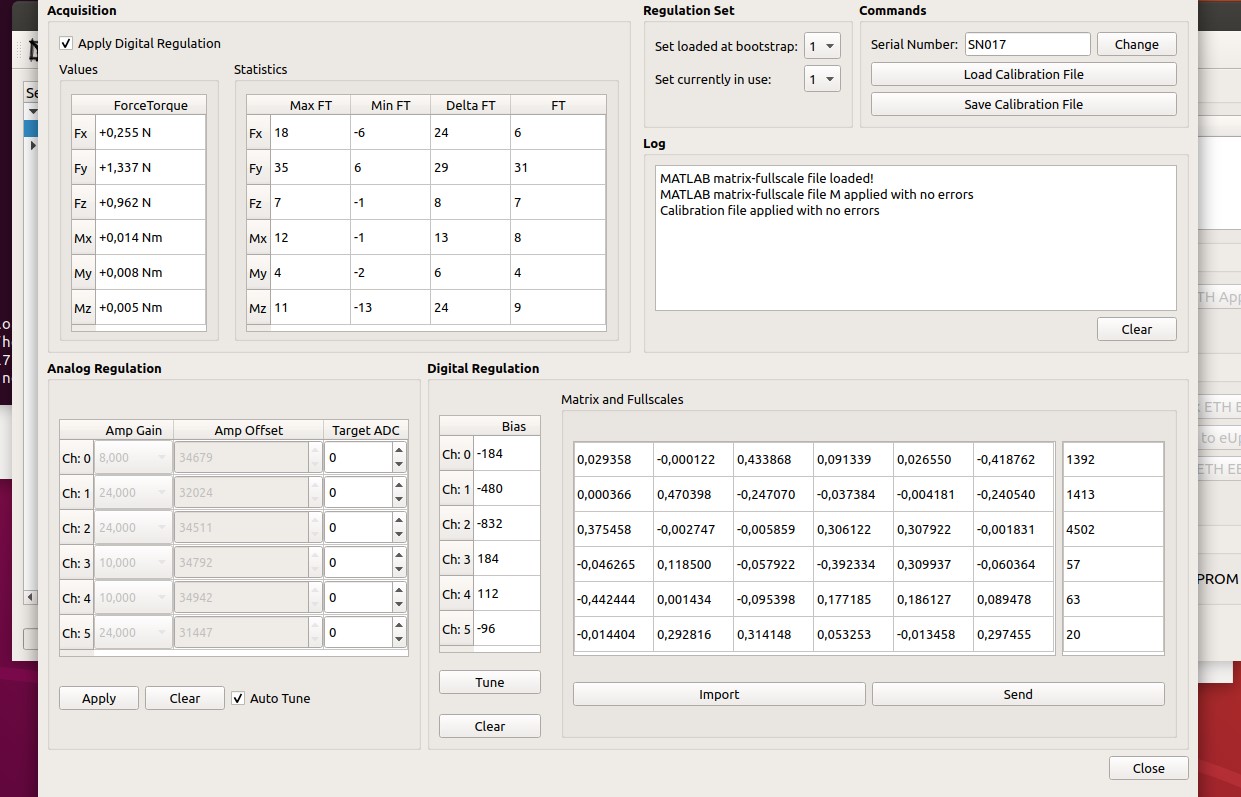
Figure 60 ________________________________________________________________________________________________
- Select EEPROM->Save to EEPROM in the top bar
- Select Save Calibration File and select the sensor folder (/home/icub/calibration-ft-sensors/software/sensAquisitionArchive/cod_iit_XXX/SNXXX)
- Check that the measurement of Fz on the z axis is nearby 0
- Apply 1kg on the top of the sensor and check that the measurement of Fz on the z axis is nearby 10 or -10 (it depends on which side of the senor the load is placed) - see figure 61
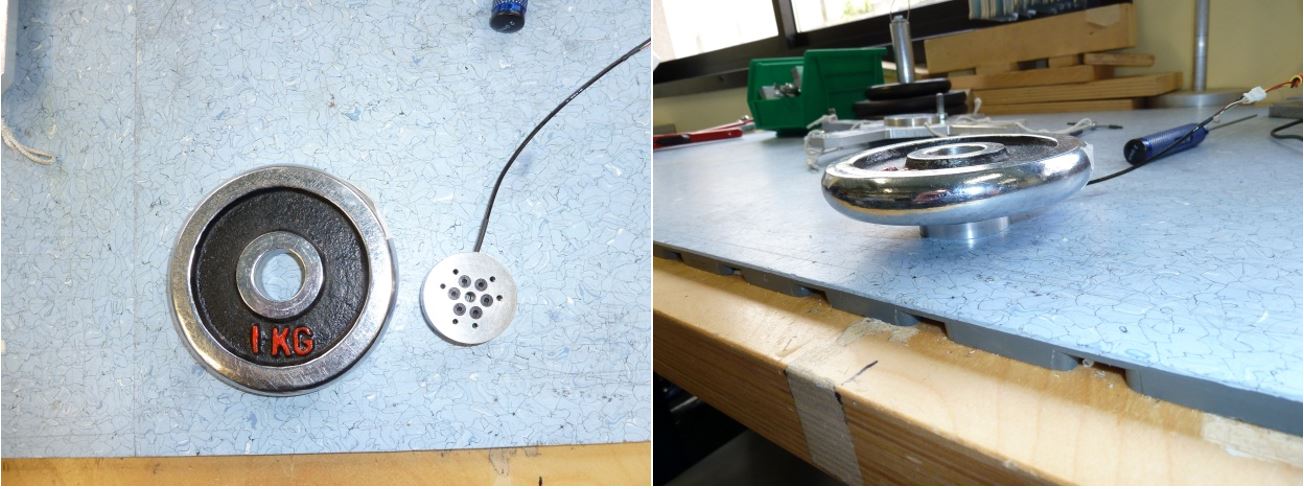
Figure 61 ________________________________________________________________________________________________
7 Committing Files
In a terminal :
-
cd /home/icub/calibration-ft-sensors/software/sensAquisitionArchive/cod_iit_XXX
-
Do “git add SNXXX”
- type “git commit -am "SNXXX - new calibration data and matrix"”
- type “git push”
- Now you can close Ubuntu VM and do "git pull" on windows calibration-ft-sensors folder
8 Sensor Calibration Report
| SENSOR S/N: | |
| Test Date: | Tester: |
| Strain Gauge S/N: |
| Test | Passed | Failed |
|---|---|---|
| 2.1 Strain Gauge Resistance check | ||
 |
||
| 2.2 Short circuit Check | ||
| Note: | ||
| 4.1 Z+ pointing downwards 25kg traction | ||
| Note: | ||
| 4.2 Z+ pointing downwards 5kg torques | ||
| Note: | ||
| 4.3 Z+ pointing upwards 25kg compression | ||
| Note: | ||
| 4.4 X+ pointing upwards 25kg | ||
| Note: | ||
| 4.5 X- pointing upwards 25kg | ||
| Note: | ||
| 4.6 “1” pointing downwards 25kg | ||
| Note: | ||
| 4.7 “2” pointing downwards 25kg | ||
| Note: | ||
| 4.8 “3” pointing downwards 25kg | ||
| Note: | ||
| 4.9 “4” pointing downwards 25kg | ||
| Note: | ||
| 4.10 X+ pointing upwards 5kg laterals | ||
| Note: | ||
| 4.11 Y+ pointing upwards 5kg laterals | ||
| Note: | ||
| 4.12 X- pointing upwards 5kg laterals | ||
| Note: | ||
| 4.13 Y- pointing upwards 5kg laterals | ||
| Note: |
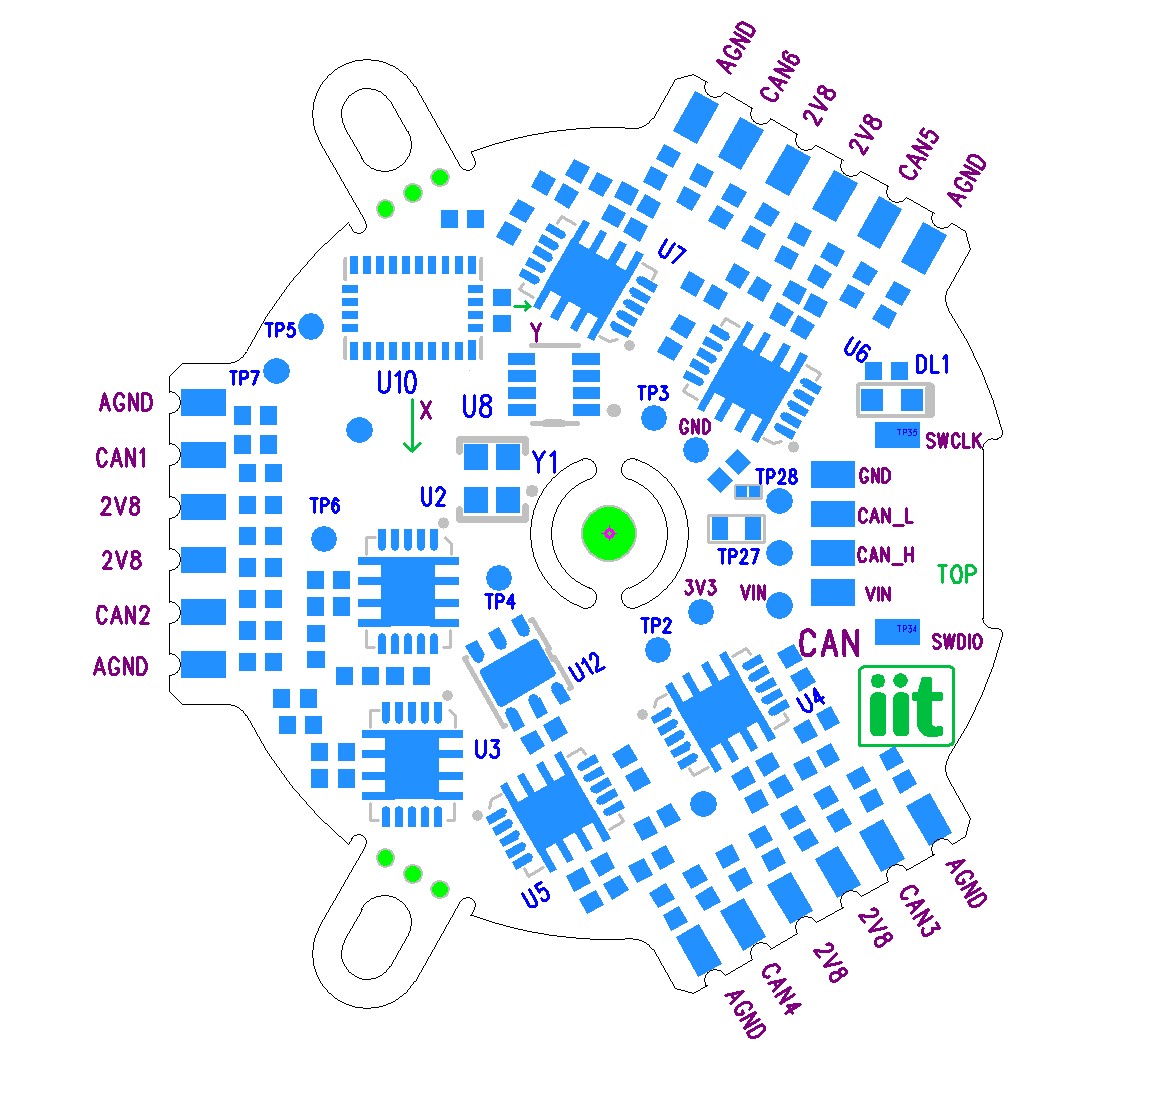
9 ADDENDUM: STRAIN2 PCB PADA-Channel Relationship